Geometry Variation and Assessment
This tutorial shows you how to automatically vary geometry by using design variables and design engines. You will be able to browse through created variants and display the different geometries. In addition, some basic information is given about the design results table and its functionality.
You can check this helpful video giving you a good introduction to the main modeling concept.
For more information about checking bounds of geometry variables, take a look at the documentation on Design Variable Bounds.
In this tutorial, the geometry gets varied without considering any simulation software (e.g. CFD analysis of the new designs).
Connection of external software for one-click performance analysis is covered in later tutorials.
If you prefer watching a video, this tutorial is also available as a video tutorial:
Watch Tutorial VideoModel Preparation
Initial Geometry
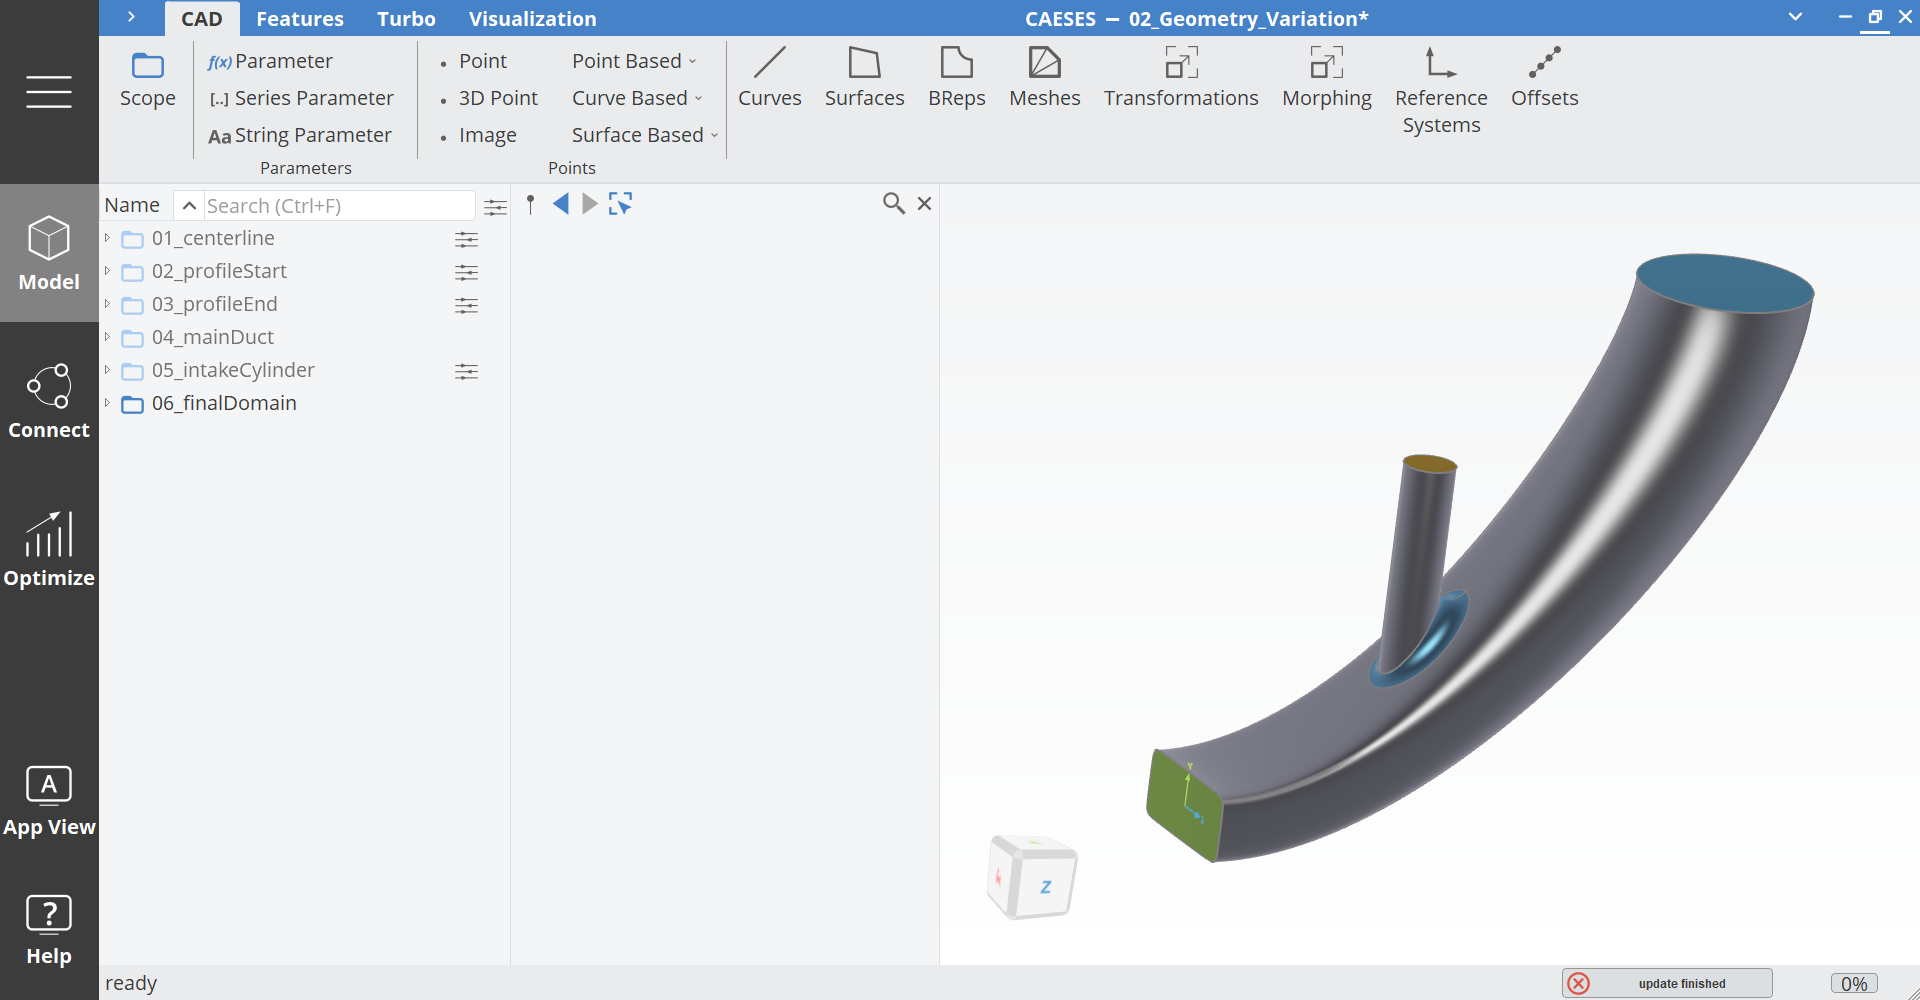
This tutorial is based on the tutorial First Modeling Steps for which a resulting project file is available:
-
Download and open the project "First Modeling Steps"
Load Final Model -
Save this project via Menu > File > Save Project As so that we do not modify the original tutorial file.
Evaluation Parameter
In order to evaluate certain properties of the geometry variants, we can use parameters. In this example we will evaluate the volume of the duct geometry without the intake cylinder.
- Switch to the Model workspace.
- Click with the middle mouse button on the scope 04_mainDuct to make it the working scope.
- Create a new parameter via Model > CAD > Parameters > Parameter and set the name to "volume".
- Click inside the Value field of the parameter.
- Press the Alt key and select the BRep ductClosed inside the scope 04_mainDuct.
- Now write
.getvand use auto completion (Ctrl+Space) and selectgetVolume(). - Convert the expression from mm3 to m3:

Workspace Optimization
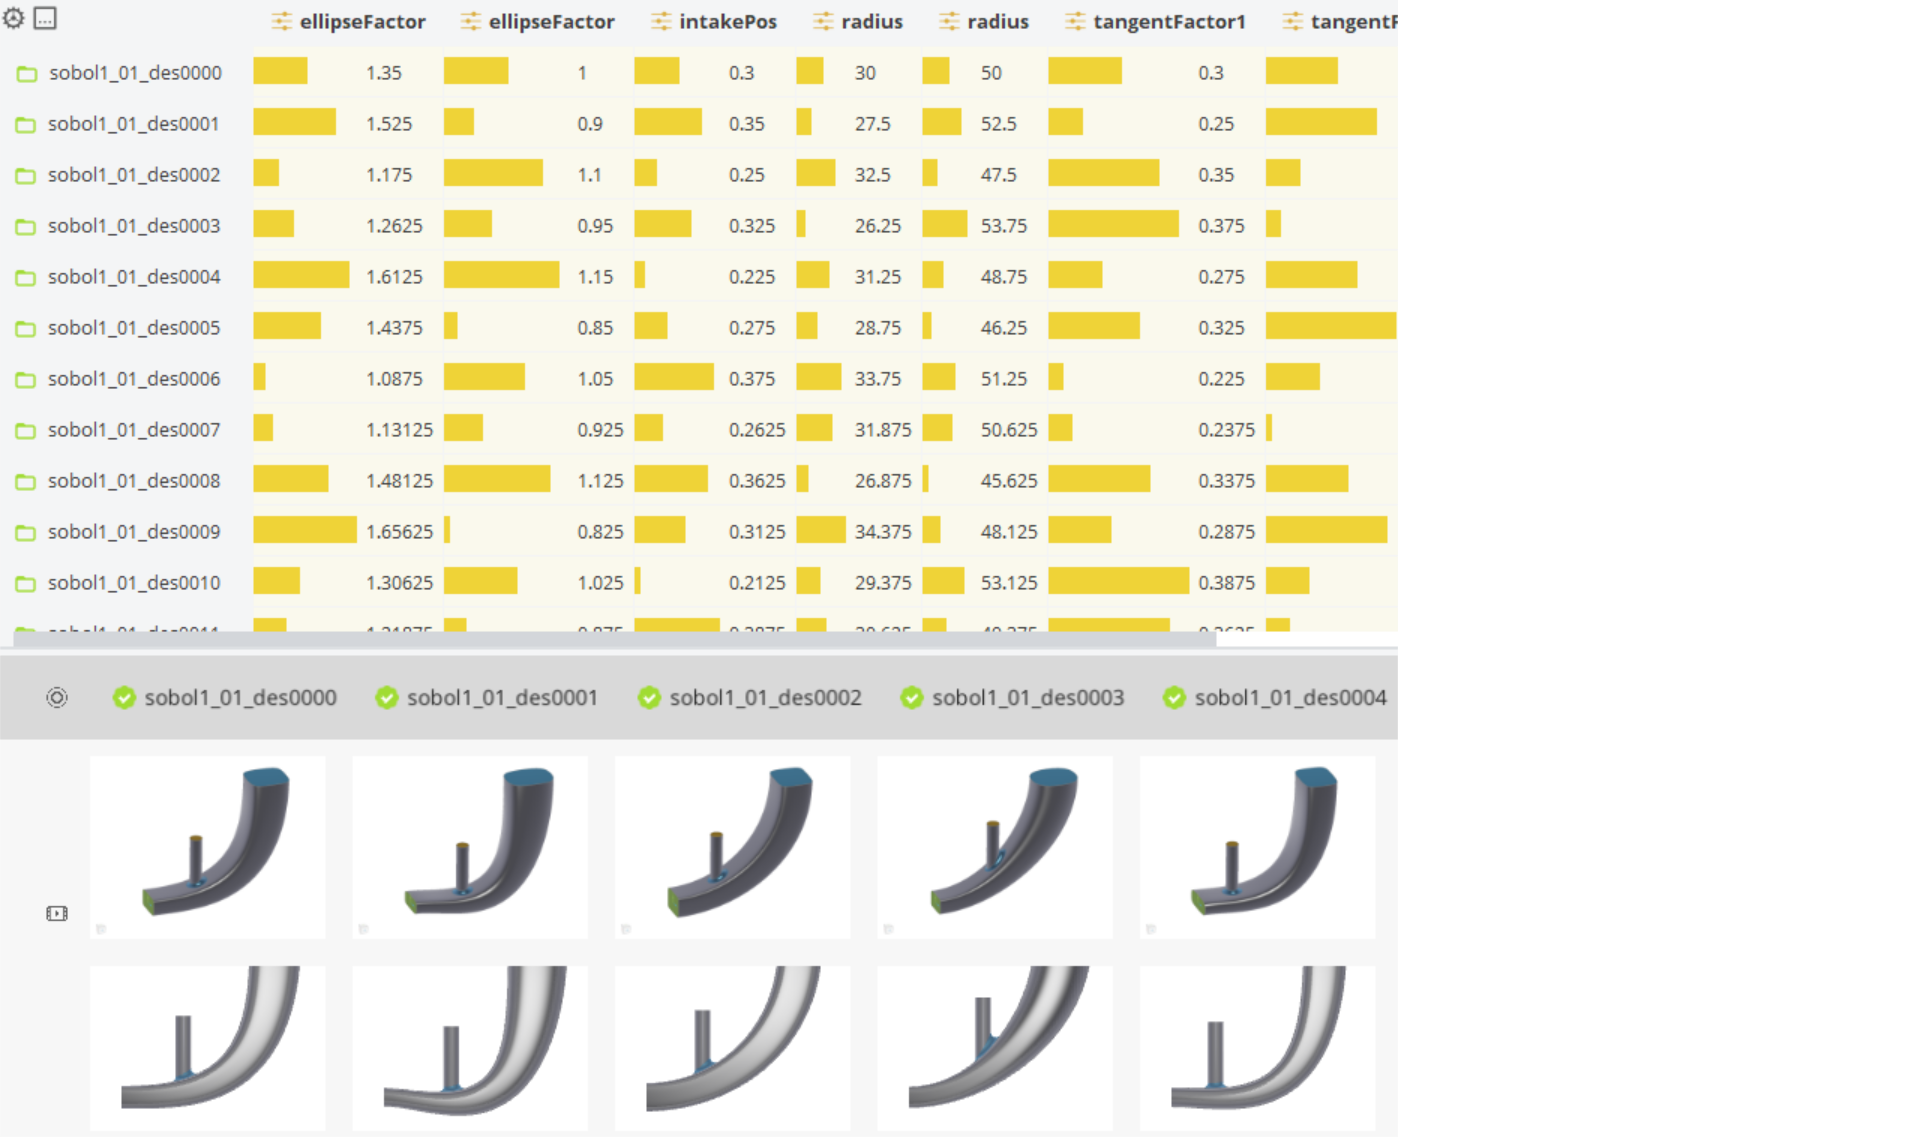
In the left sidebar you can find the workspace Optimize. Inside this workspace you can create variations and optimizations and it will store all designs and tables. Here is an example, which shows our Optimize workspace at the end of the tutorial:

- Click in the left sidebar on Optimize in order to move to this workspace.
Design Engine
For variation and optimization so-called design engines are provided. They can access and modify design variables automatically. For each modification they create a variant which is then available to the user.
Sobol
- Create a Sobol engine via Optimize > Design Space Exploration > Sobol. The Sobol will get a node in the object tree under Design Engines.
- Select Sobol1 and set the number of variants to
15. - Select the variables from the pull down menu of the category design variables.
You will see that the bounds of the design variables are already set. This is due to the fact that we already set the bounds at each design variable individually in the previous tutorial. But you can also change these bounds manually inside the design engine. Note that this will only change the bounds for this design engine alone.
- Set the volume parameter in the Evaluations category below the design variables.
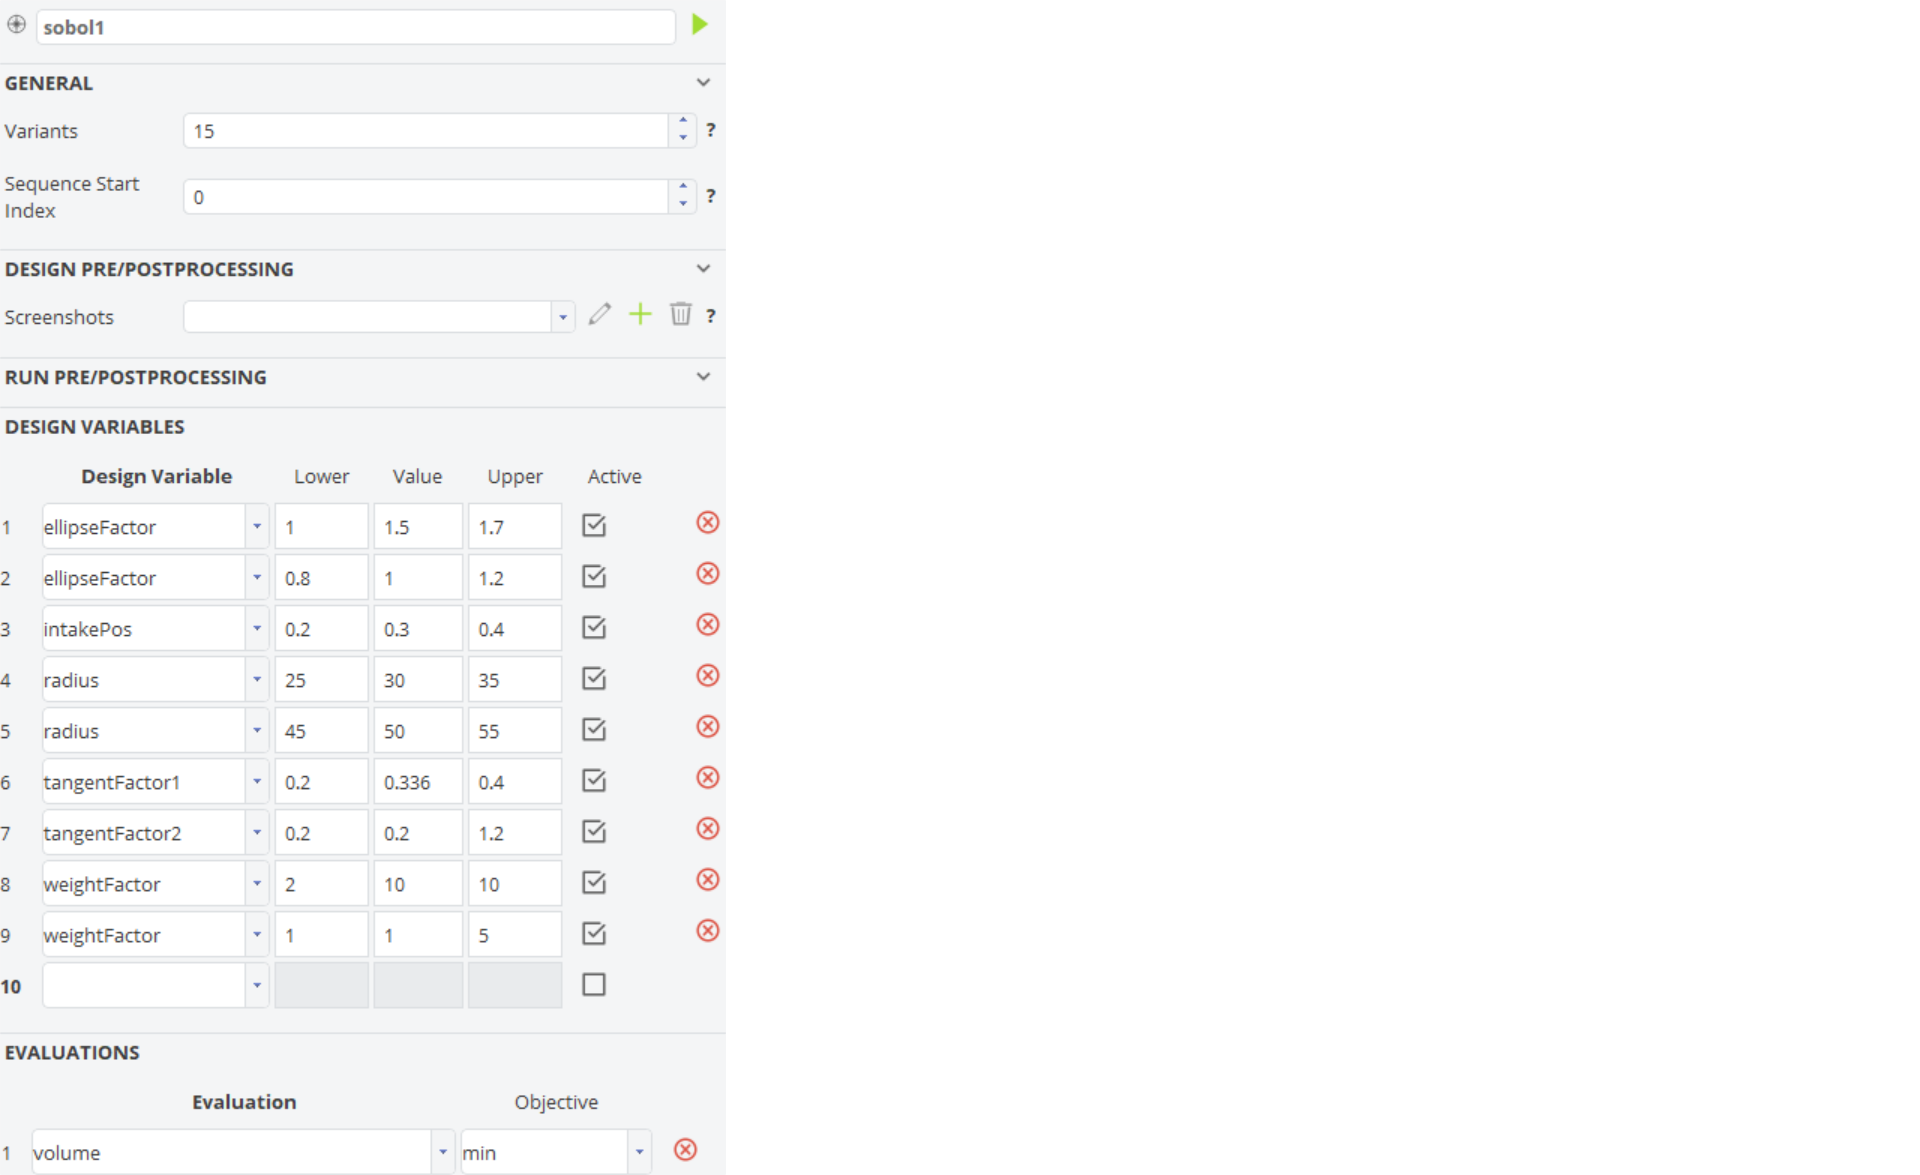
A Sobol variation strategy is typically used for Design of Experiments (DoE). It is a pseudo random-number generator which distributes design variables uniformly in the design space. For single- and multi-objective optimization, the procedure is identical apart from specifying objectives.
Only design variables are listed in the pull down menu i.e. parameters that have been switched to be design variables. The full names of the variables incl. scopes are shown in the tool tip (hover with your mouse over the design variable name).
Screenshot Collection
We can generate screenshots of our design, which we can compare after the run has finished inside the design viewer.
- Move to the Model workspace and arrange the geometry in the 3D View so that it nicely fits into the scene.
- Move back to the Optimize workspace and select Sobol1.
- Under the category Design Pre/Processing of the Sobol you find the screenshot argument. Click on the plus button to create a new screenshot collection.
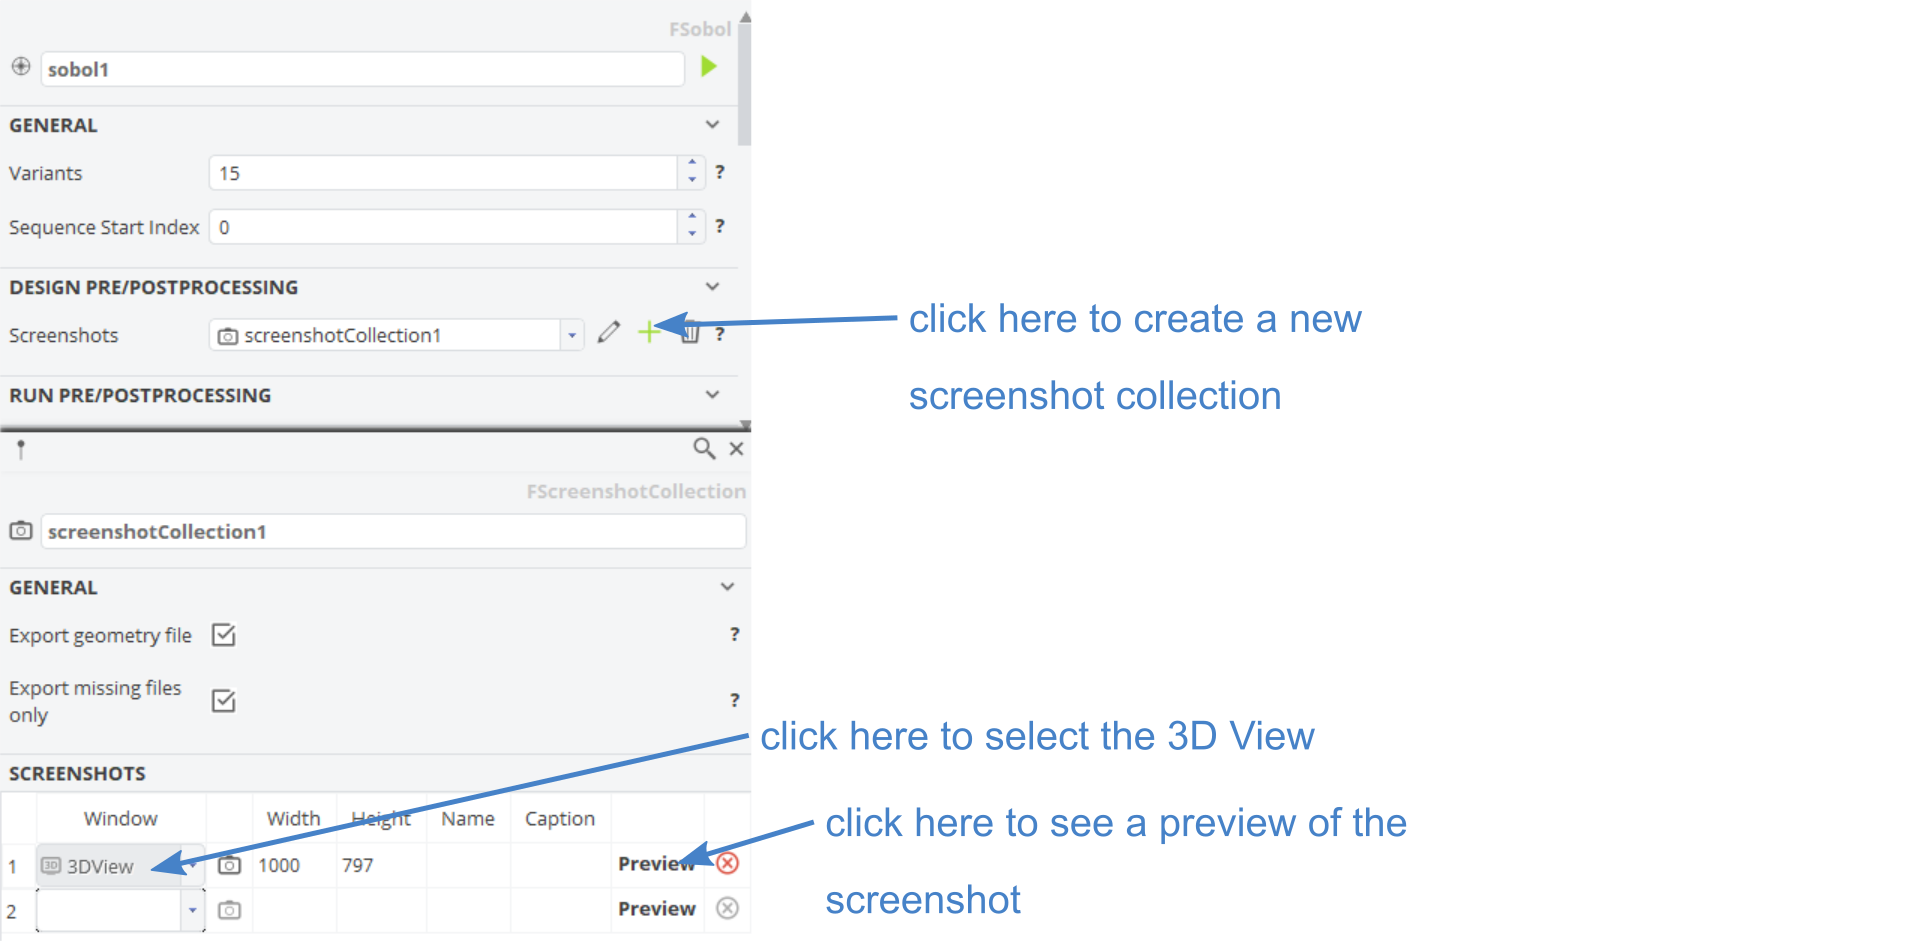
- After following the steps in the screenshot above, close the editor of the screenshot collection with a click on the close button in the top right of the screenshot collection editor.
Run the Sobol
The design engine has been configured and is now ready to run.
- With the Sobol design engine selected, click on the green play icon in either the quick action toolbar or next to the name field of the Sobol.
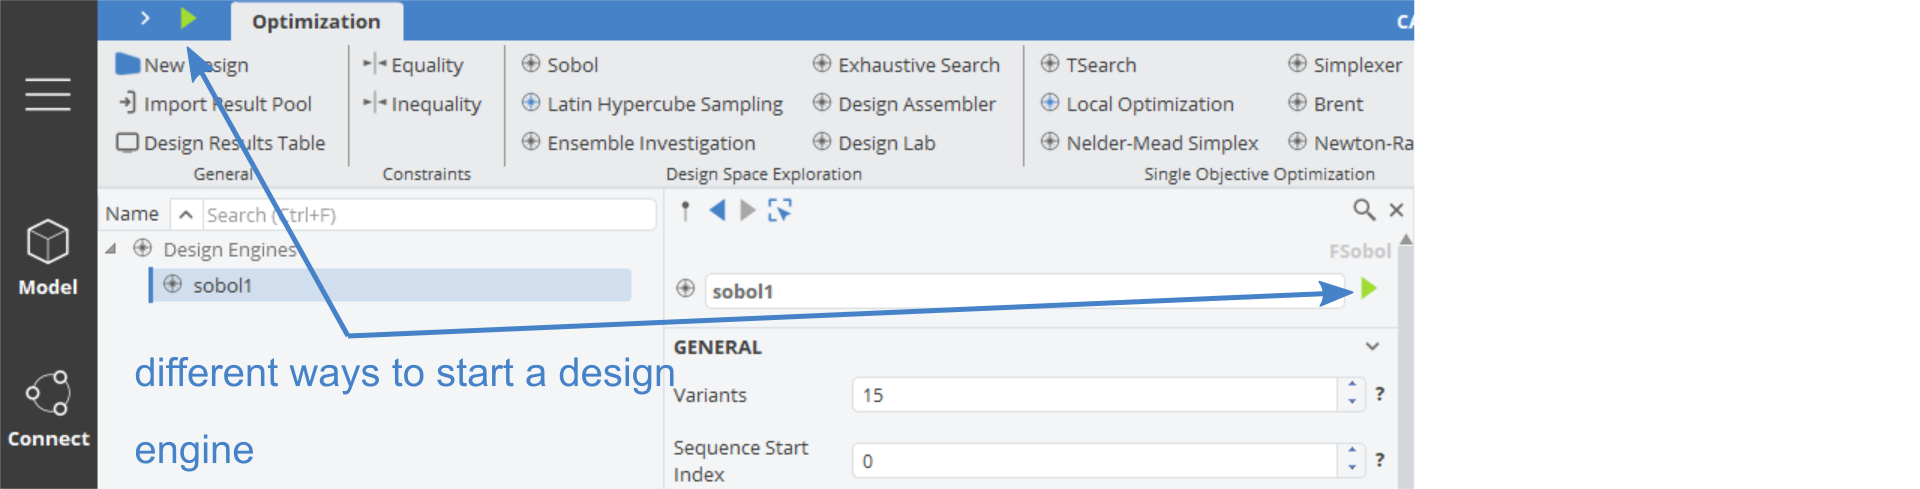
Now the variants are getting created along with a table which documents them. Wait until the generation process is finished. In the quick action toolbar you can now see a Pause and a Stop button. You can click these if you need to pause or stop the design engine.
Design Results Table
After the sobol was started, a results table was created with all designs and design variables. The design results table provides sorting mechanisms with regard to its entries. Sorting can be done by clicking on the header of the parameter or design variable once or twice for increasing or decreasing order.
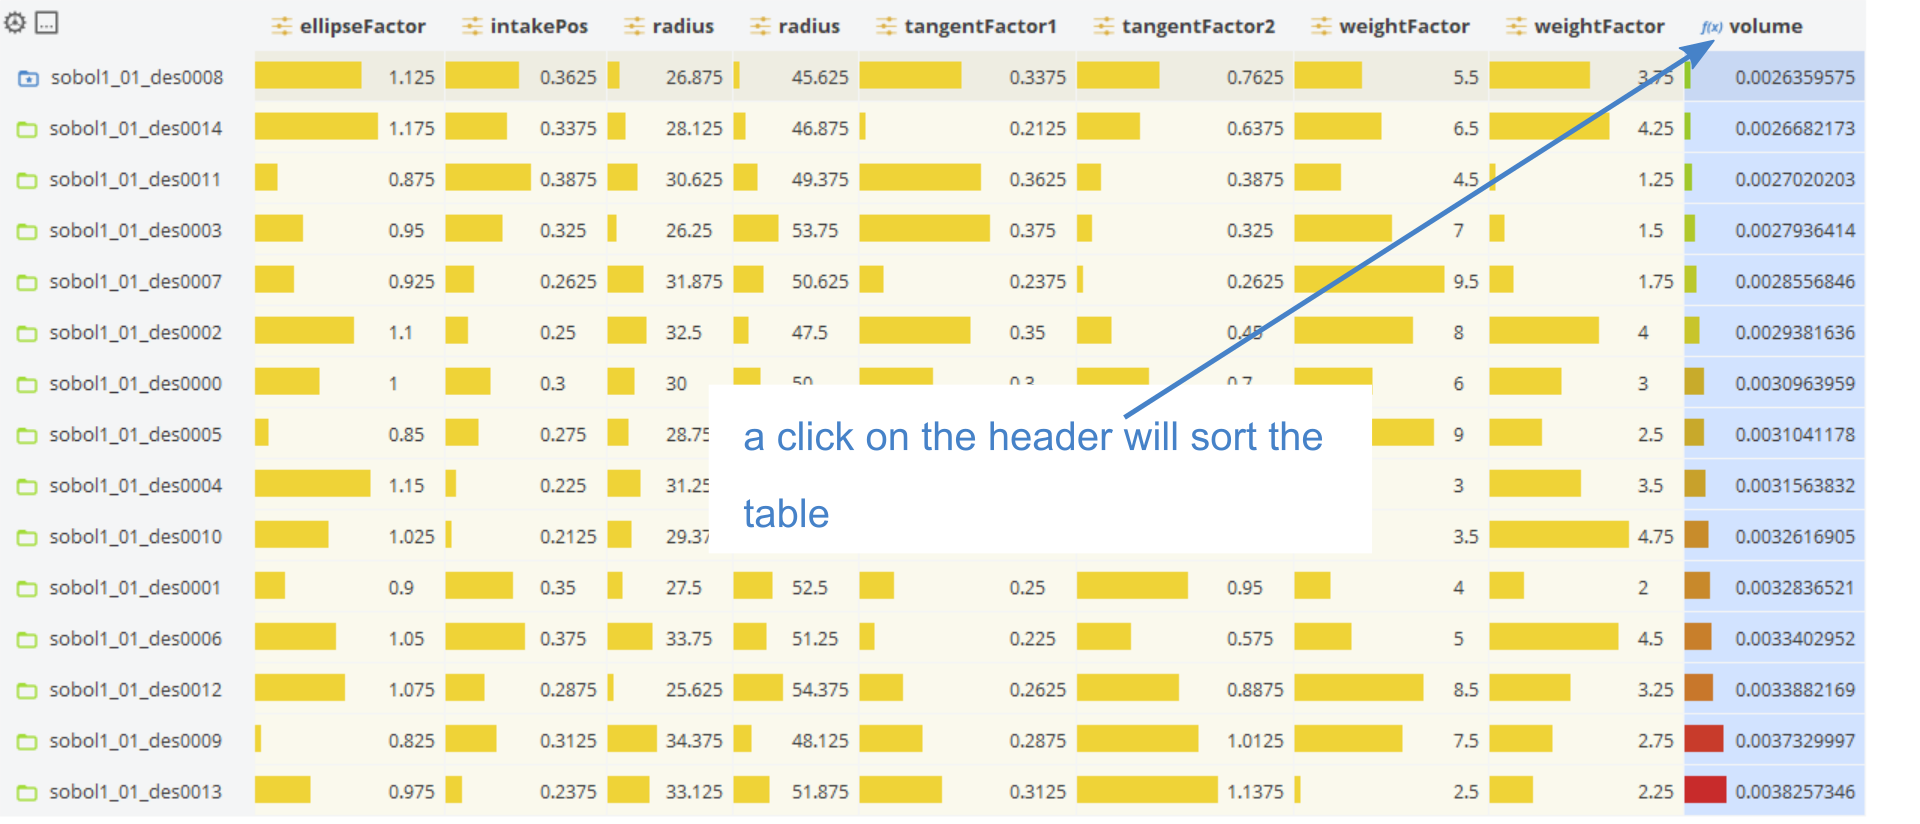
Result tables can be customized. New tables can be created via Optimize > General > Design Results Table.
Parameters, design variables, constraints from the model and even designs from the design tree can be inserted via drag & drop to an empty table widget. To add a design variable to the table use the Search field above the object tree and drag and drop the design variable to the table widget. Designs can also be dragged into a generated result table like the one above e.g. to compare designs from different engine runs.
Design Viewer
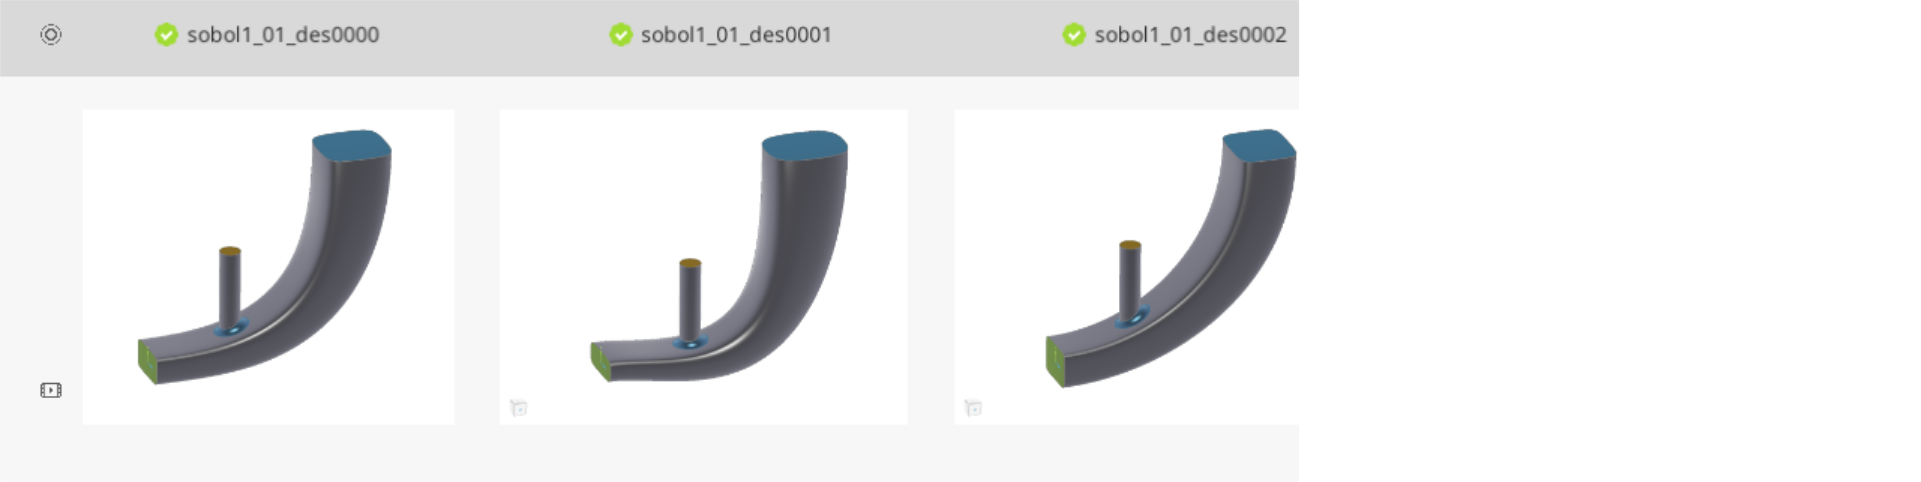
If you created a Screenshot Collection it is easy to compare these within the design viewer.
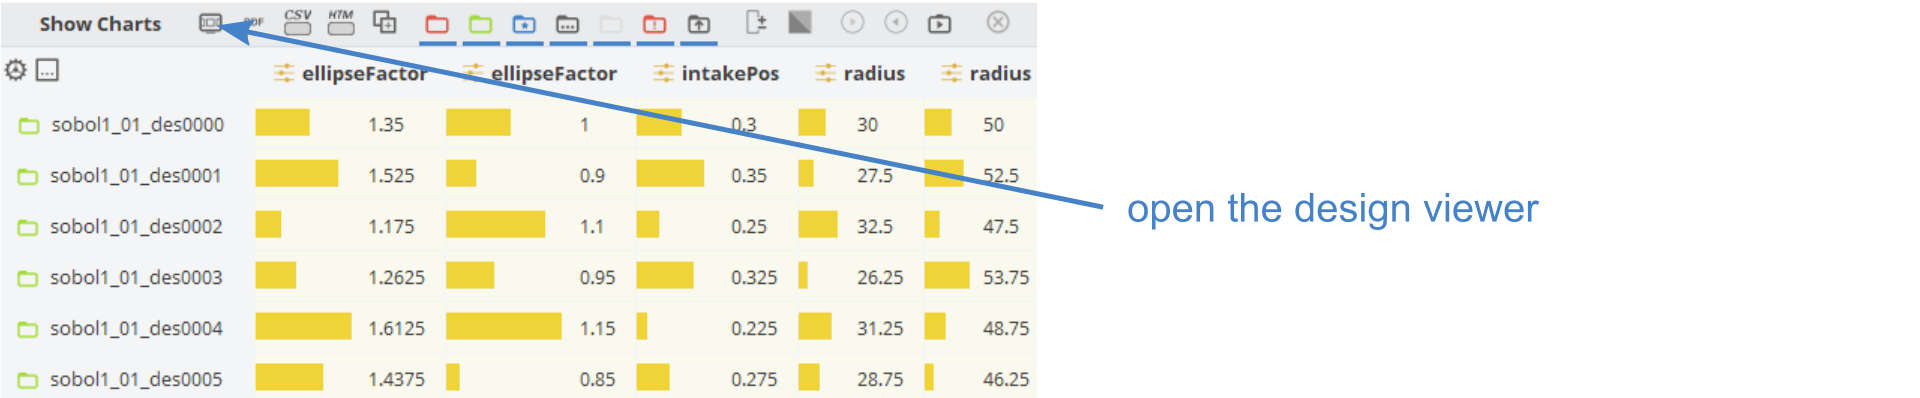
- Click on the design viewer icon in the top left of the design results table.
- In the design viewer scroll with the middle mouse button to zoom in and out.
- The first row (right above the table values) contains an interactive 3D window. Keep the Ctrl key pressed while using your other mouse buttons to rotate or zoom in.
Create a Gif Animation
In the design viewer you can directly create a GIF animation of the available screen-shots.
- Click to create a GIF animation for the selected row of screenshots.
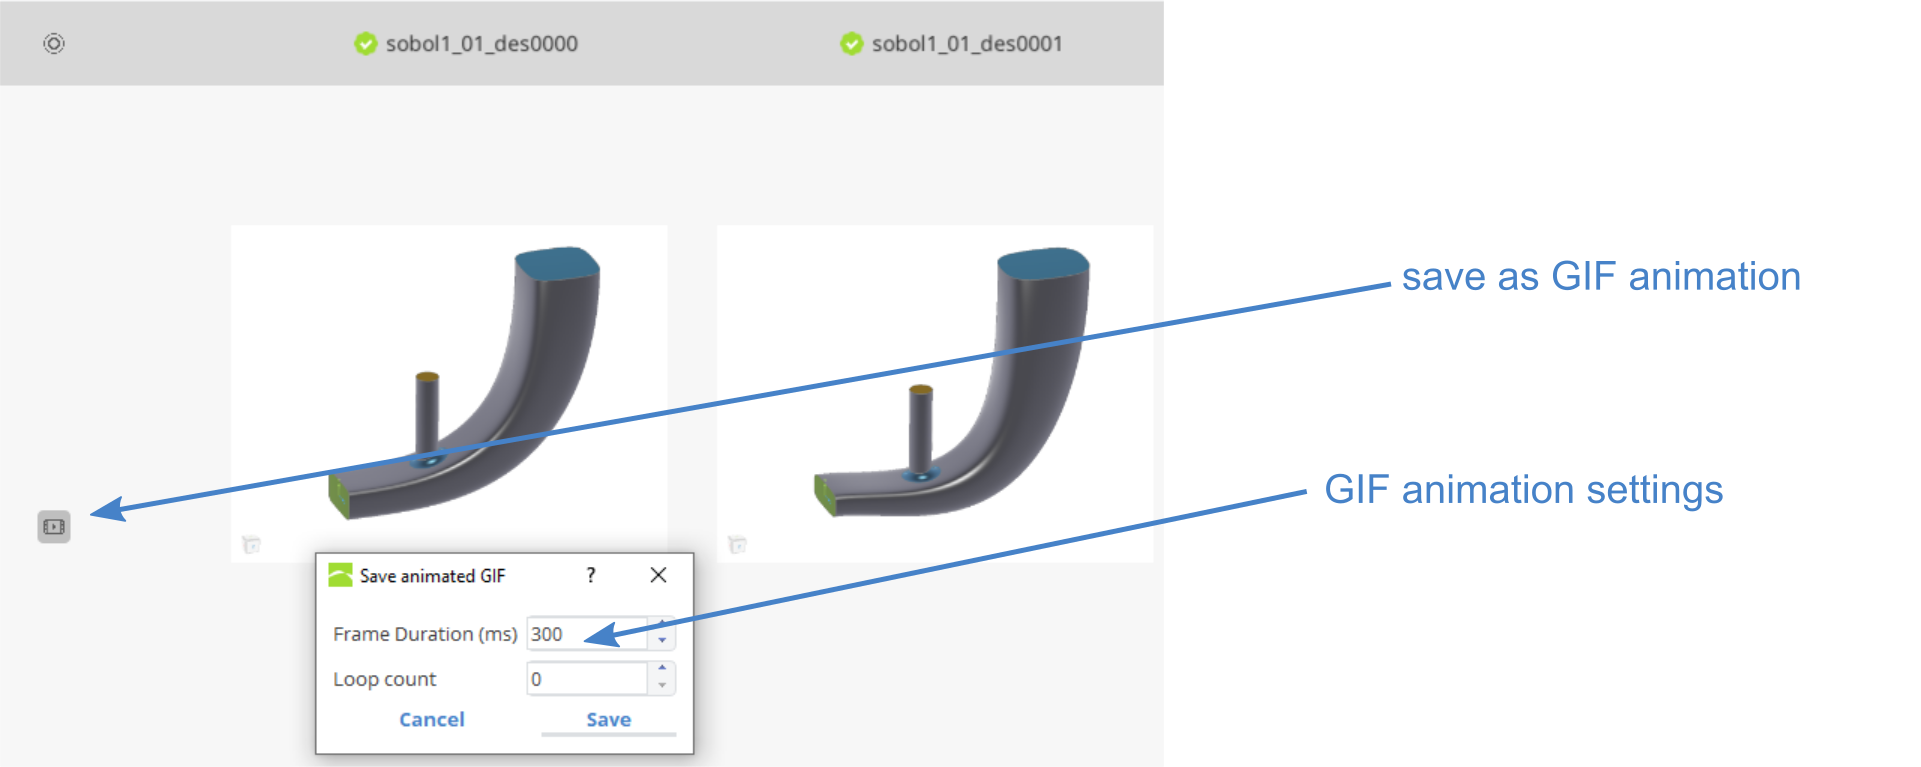
A Save Dialog window is opened.
- Choose a folder location to save your GIF file.
- Click on save.
- Set the frame duration to
400 ms. - Keep the default loop count.
- Click on Save.
You can find and open the saved gif file in your chosen folder location.
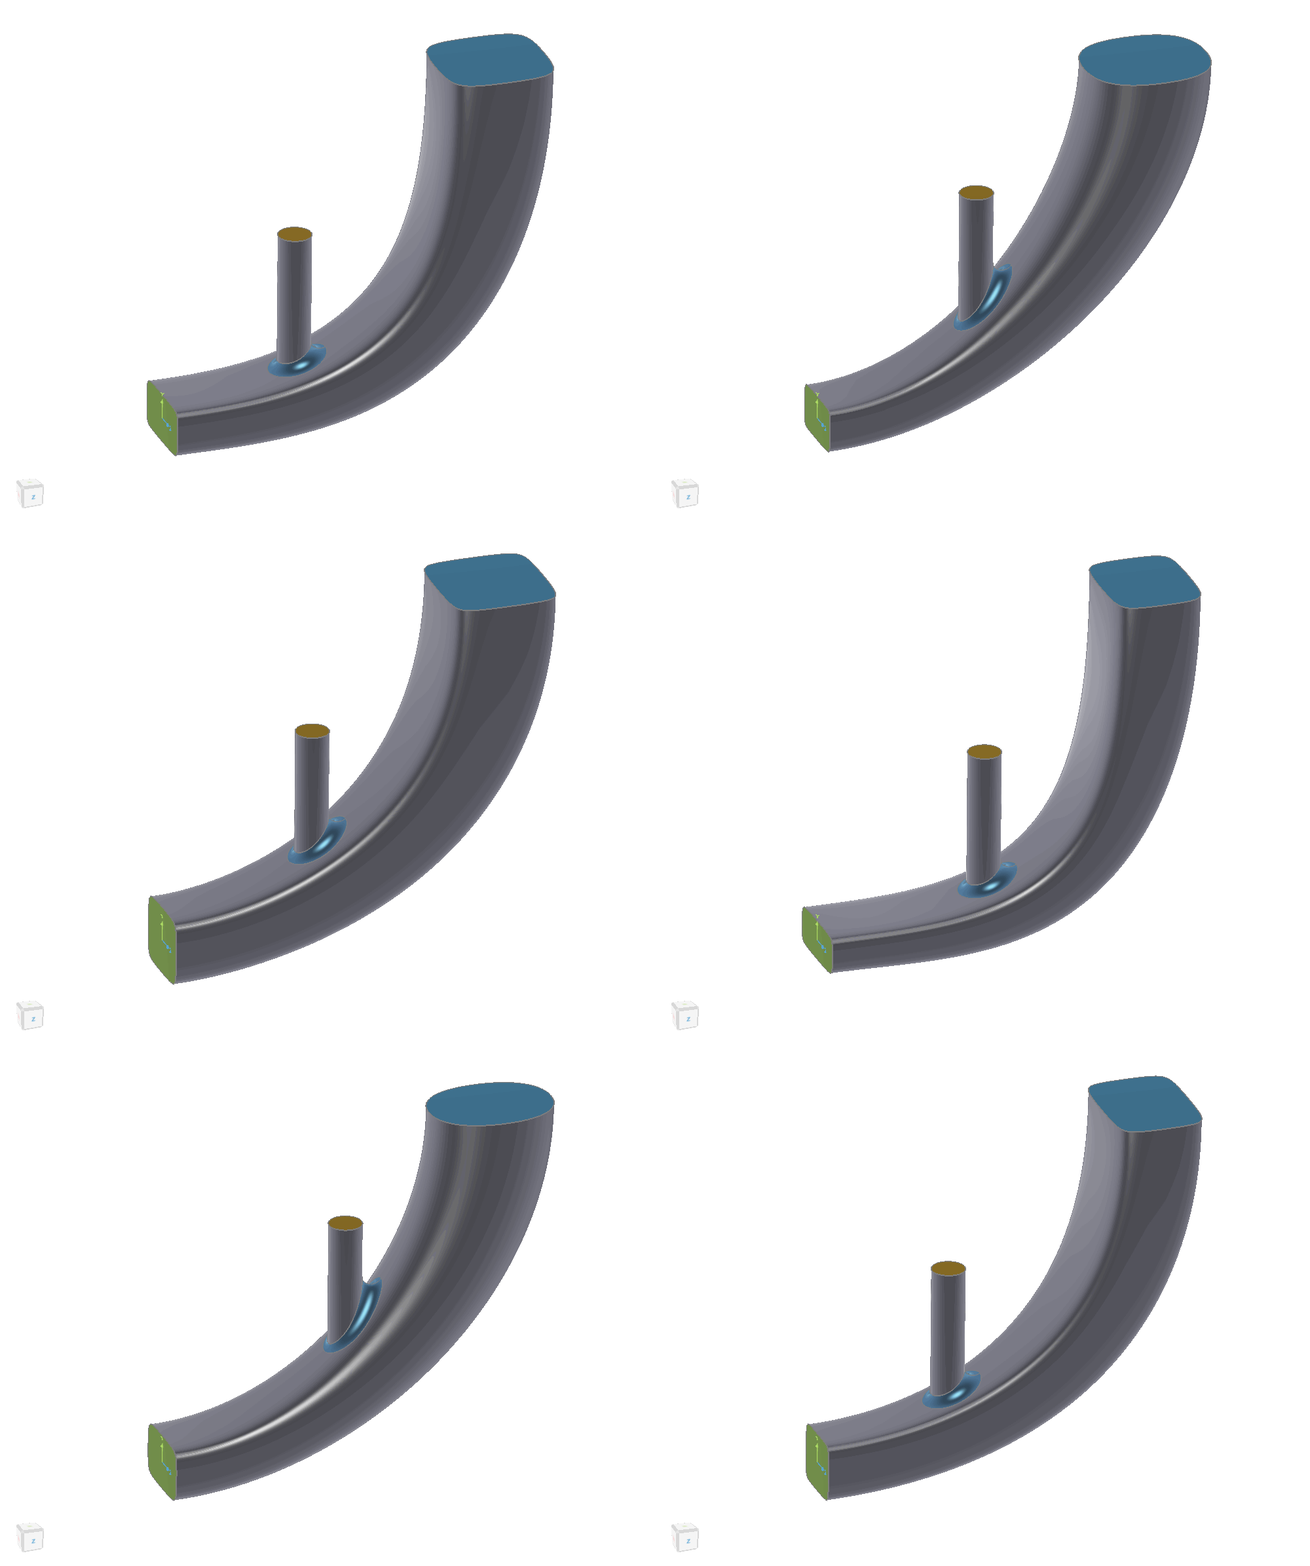
Diagrams and Charts
CAESES allows you to create 2D charts of your design table. These charts are very useful if you want to see the progression of an evaluation during an optimization run, or to analyze the influence of the design variables on the evaluations.
- Enable the chart view with the Show Charts button at the left top of the Design Results Table.
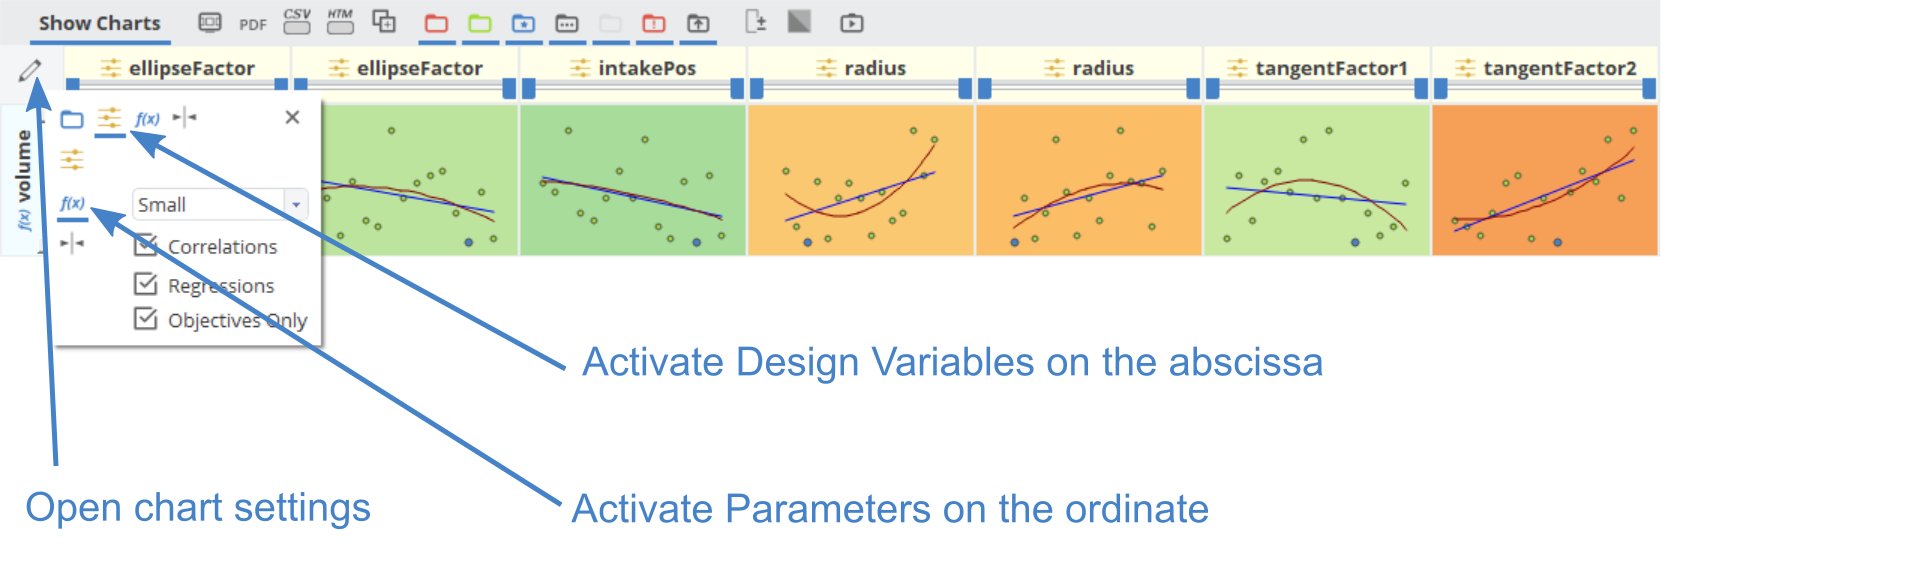
- Click on the edit button on the top left of the chart in order to open the chart settings.
In order to analyze the effect of the design variables on the evaluation parameter, we want to see the Design Variables on the abscissa and the parameters on the ordinate.
- Activate the Design Variable toggle button on the horizontal axis.
- Activate the Parameter toggle button on the vertical axis.
- Deactivate all other buttons if they are set.
- Switch the size to Small.
Now we are able to see the influence of each Design Variable on the evaluation Parameter (in our case, the volume). The background colors indicate the correlations. Red colors indicate a positive correlation and blue colors indicate a negative correlation. Yellow colors are indicating, that the correlation is very weak.
Browsing through Designs
Next we want to browse through the different variants. In particular, we want to look at the individual geometries.
- See the new node Designs in the tree with all variants and expand the tree.
- Make a single mouse click on a design (either in the tree or the design results table) in order to display the design settings in the object editor.
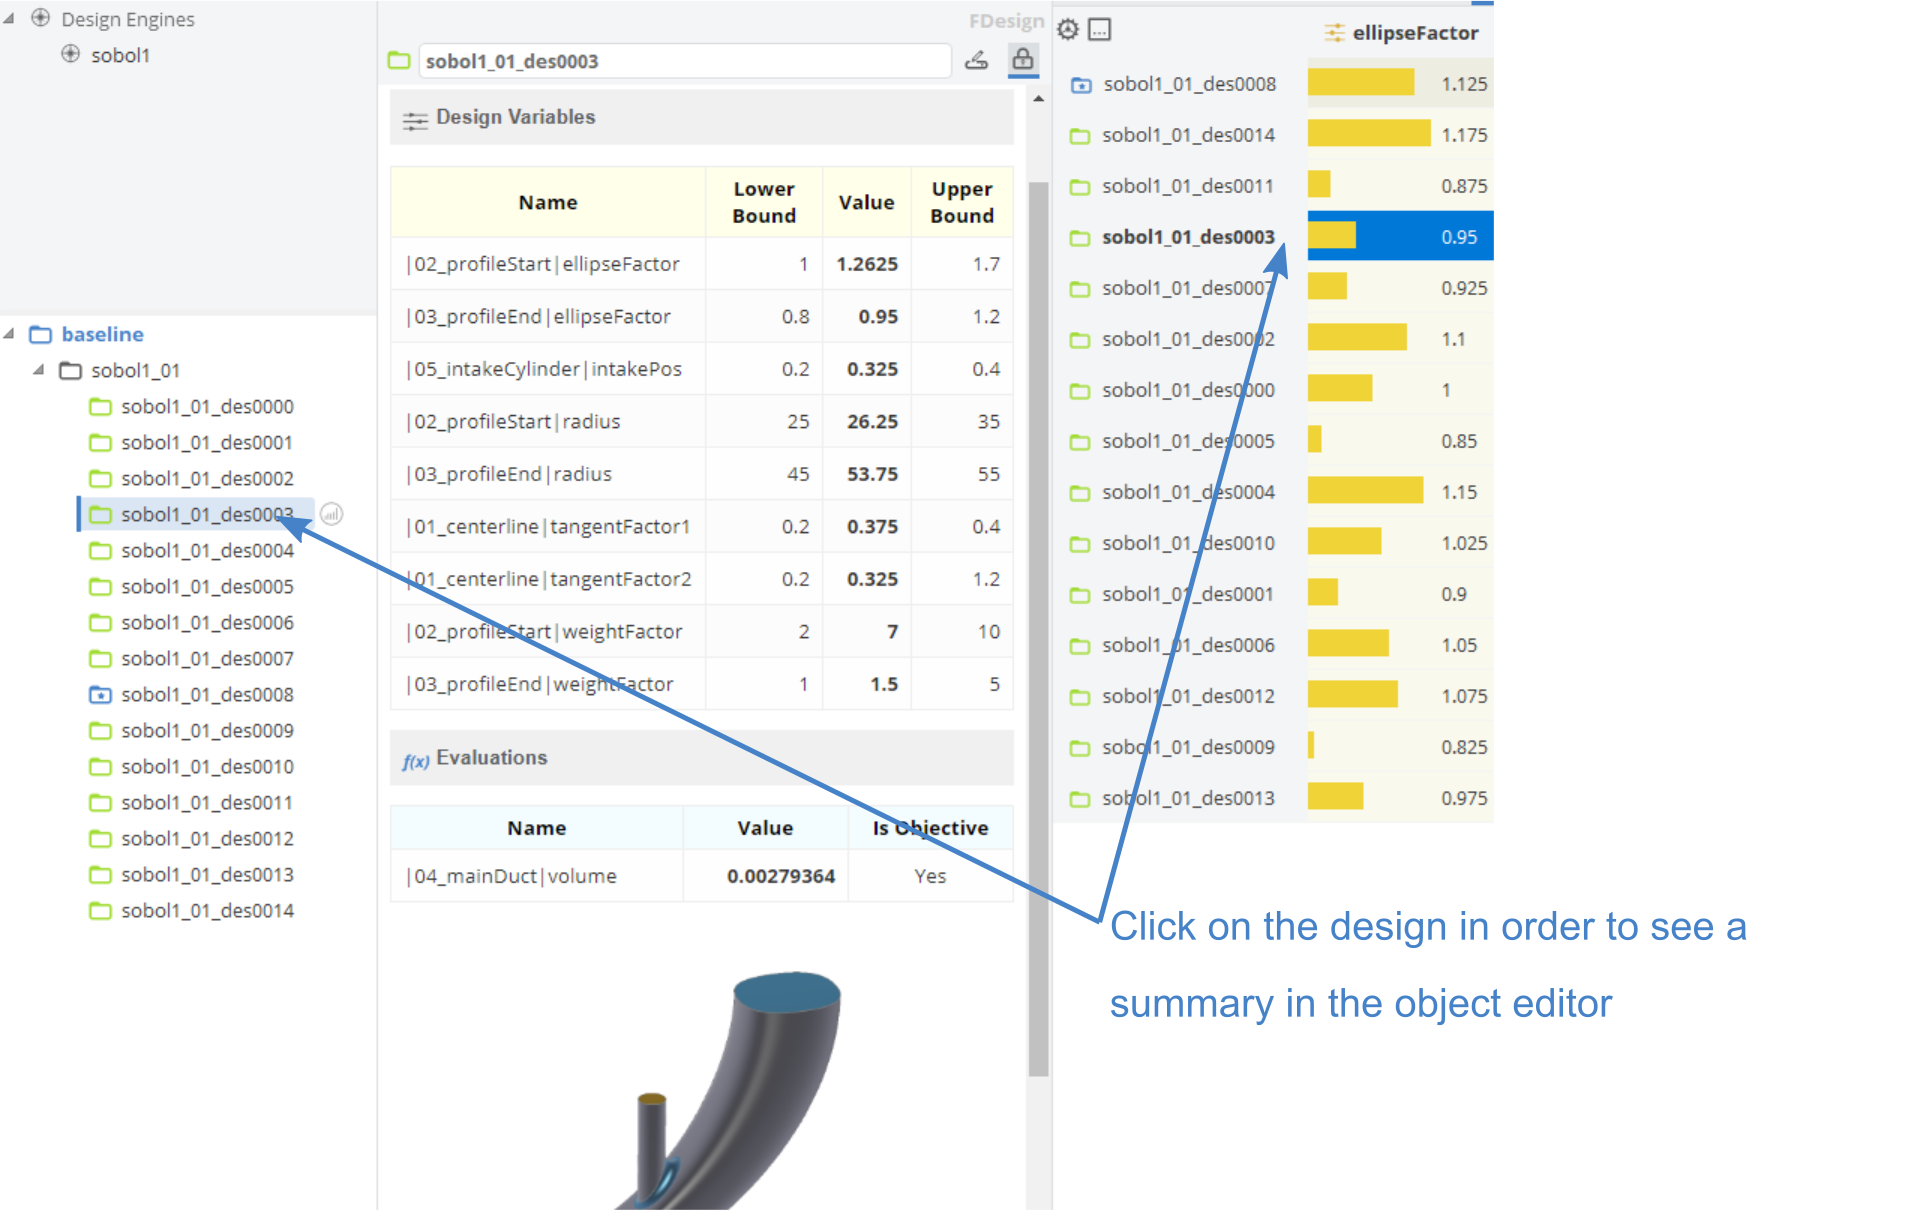
In order to see the 3D model, we can show the 3D View:
- Right click on the ribbon (or the black workspace navigation on the left side) of CAESES and select the 3D View. It will show in the central view. You could also show the 3D Overview which is by default a docked window.
- Double-click on the first design sobol1_01_des0000 in the design tree in order to activate it i.e. make it the current design. This updates the variant and shows it in the 3D View.
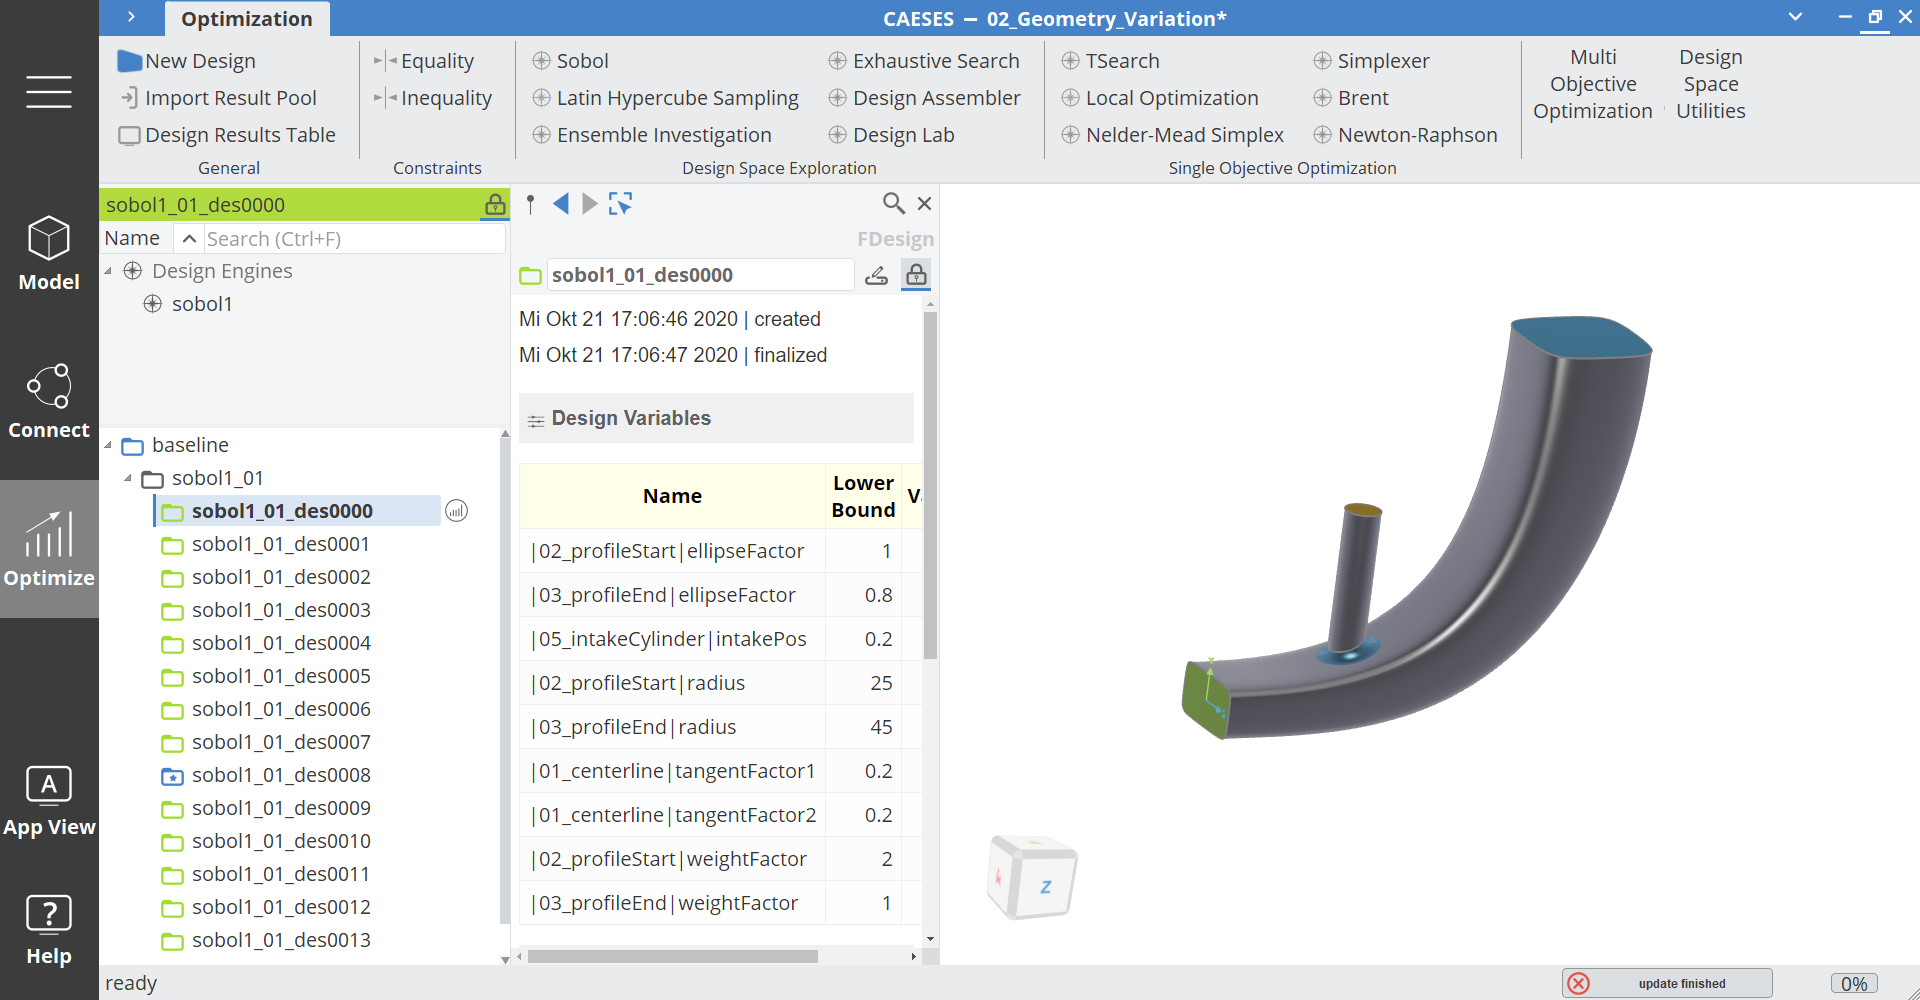
- Continue browsing via double-click on the other designs in the tree.
If you have switched to a different design than the baseline, it is indicated with a green field above the object tree. To make sure you do not accidentally change designs, which have corresponding results already, the designs are locked by default. Click on the lock-icon in the green design field, to unlock it. Then you can switch e.g. to the CAD tab and modify objects. If you have modified a design, it will be indicated with a grey icon in the design tree and Design Results Table.
- Go back to your initial design via double-click on baseline in the design tree.
A typical optimization process might start with a simple variation (exploration).
After that, a good variant is picked and activated with double-click.
Now you can create a new design from the current design (in order not to modify the existing variant for which results exist already).
For an activated design, choose Optimize > New Design.
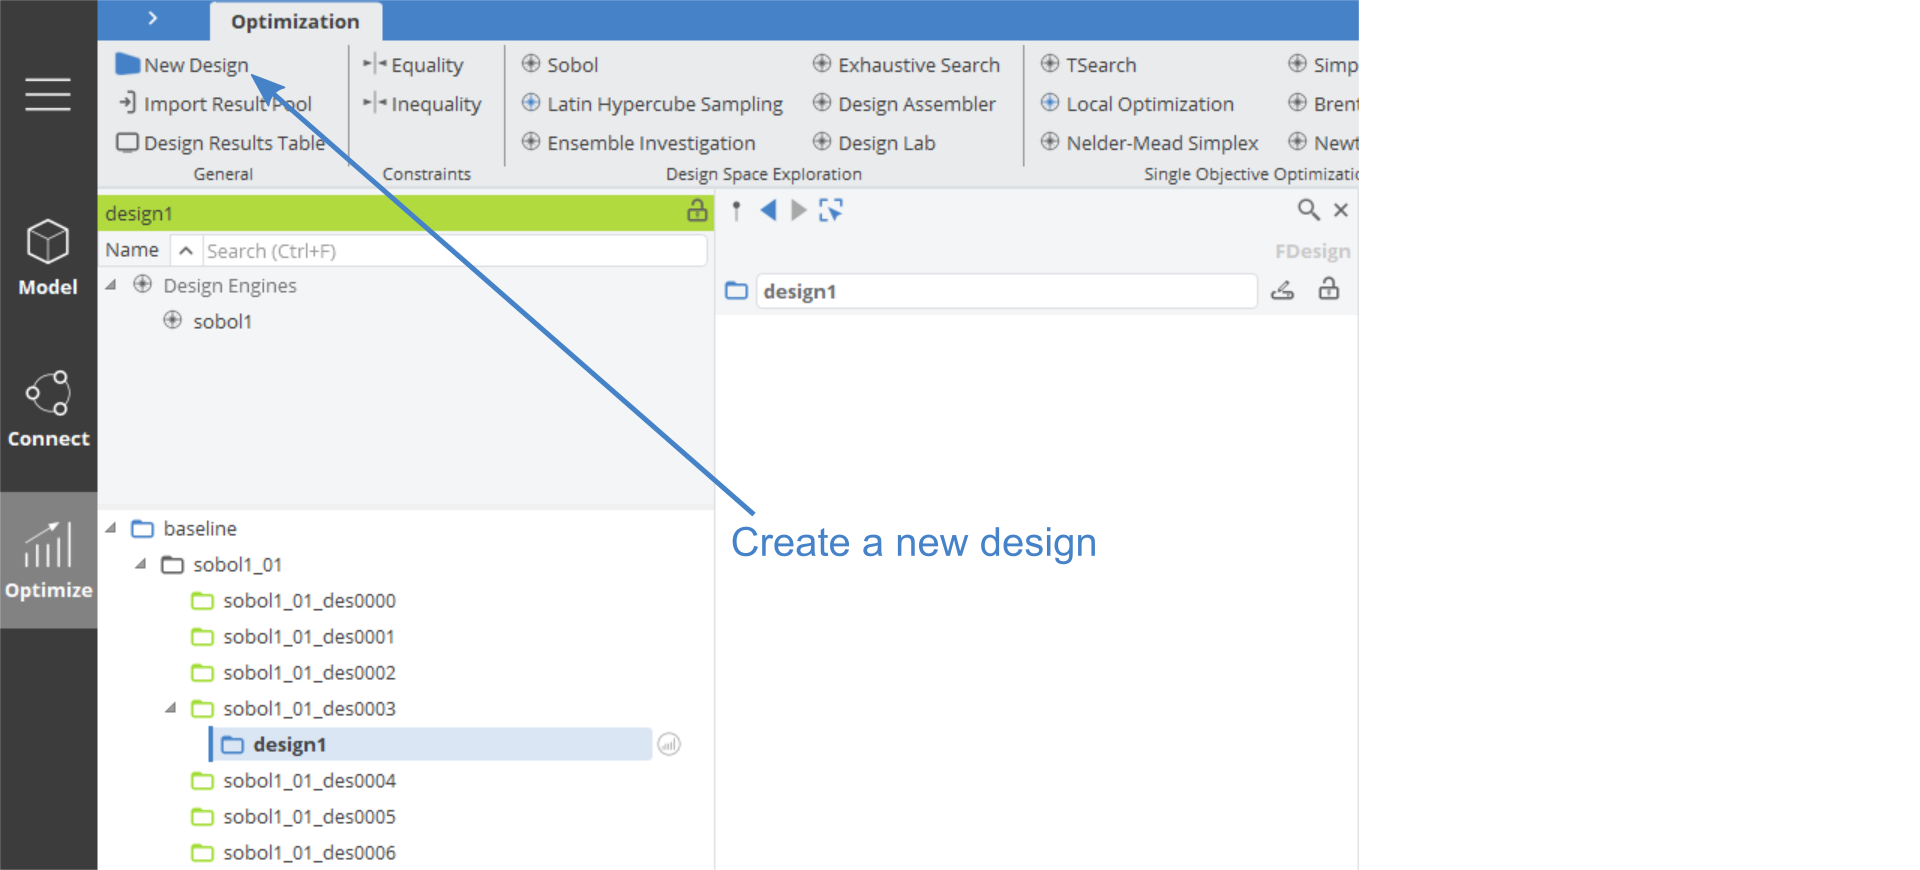 Alternatively, you can save the current design into a new project, to get rid of all the other content.
For an activated design, choose Menu > File > Save Current Design As.
Alternatively, you can save the current design into a new project, to get rid of all the other content.
For an activated design, choose Menu > File > Save Current Design As.
CAESES Project File
If you want to take a look at the finalized model you can find the resulting CAESES project file geometry-variation.cdb here: