Debugging Feature Definitions
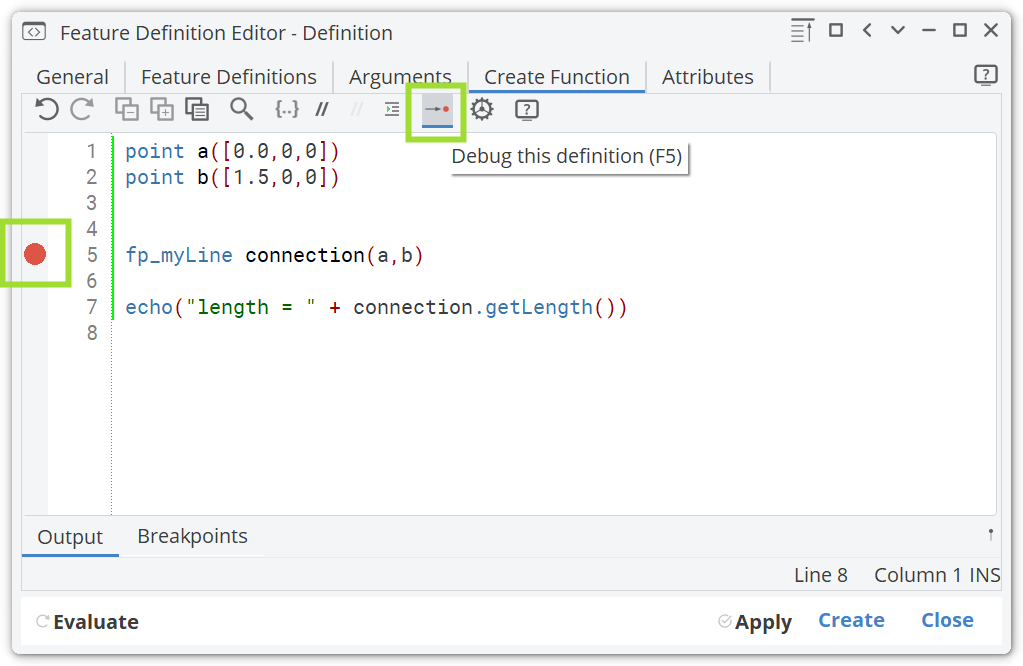
If you write rather complex feature definitions or you search for a logical error in your definition, you can run the debugger. By clicking the debugger icon in the top toolbar of the editor, the debugging mode starts where you can enter arguments and run the definition step by step. All values of attributes are monitored so that you can find problems and errors. Breakpoints are set by clicking on the left grey area of a line (e.g. in line 5 as shown below).
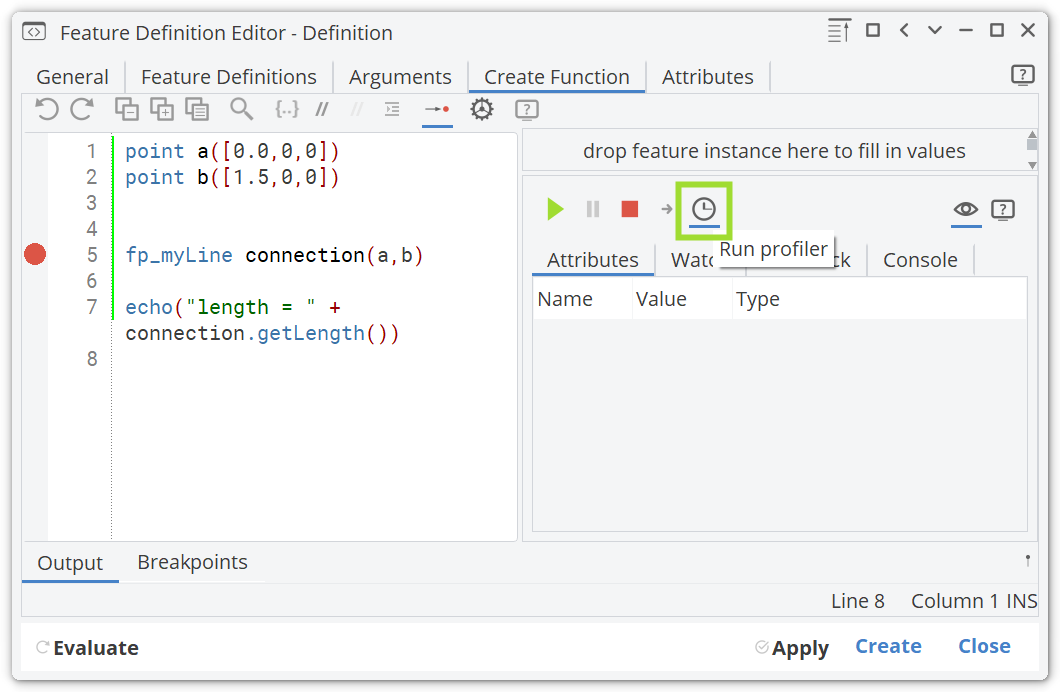
There is also a profiler option when you run the debugger, to check the performance of your definition. This helps you to find sequences in your code that are expensive and slow down your execution.