Windows, Widgets and Appearance
CAESES is logically structured in workspaces and tabs. The graphical user interface (GUI) thereby separates the CAD modeling, software connection and optimization functionalities.
The following image gives an overview of how CAESES graphical user interface is structured and also shows the terminology.
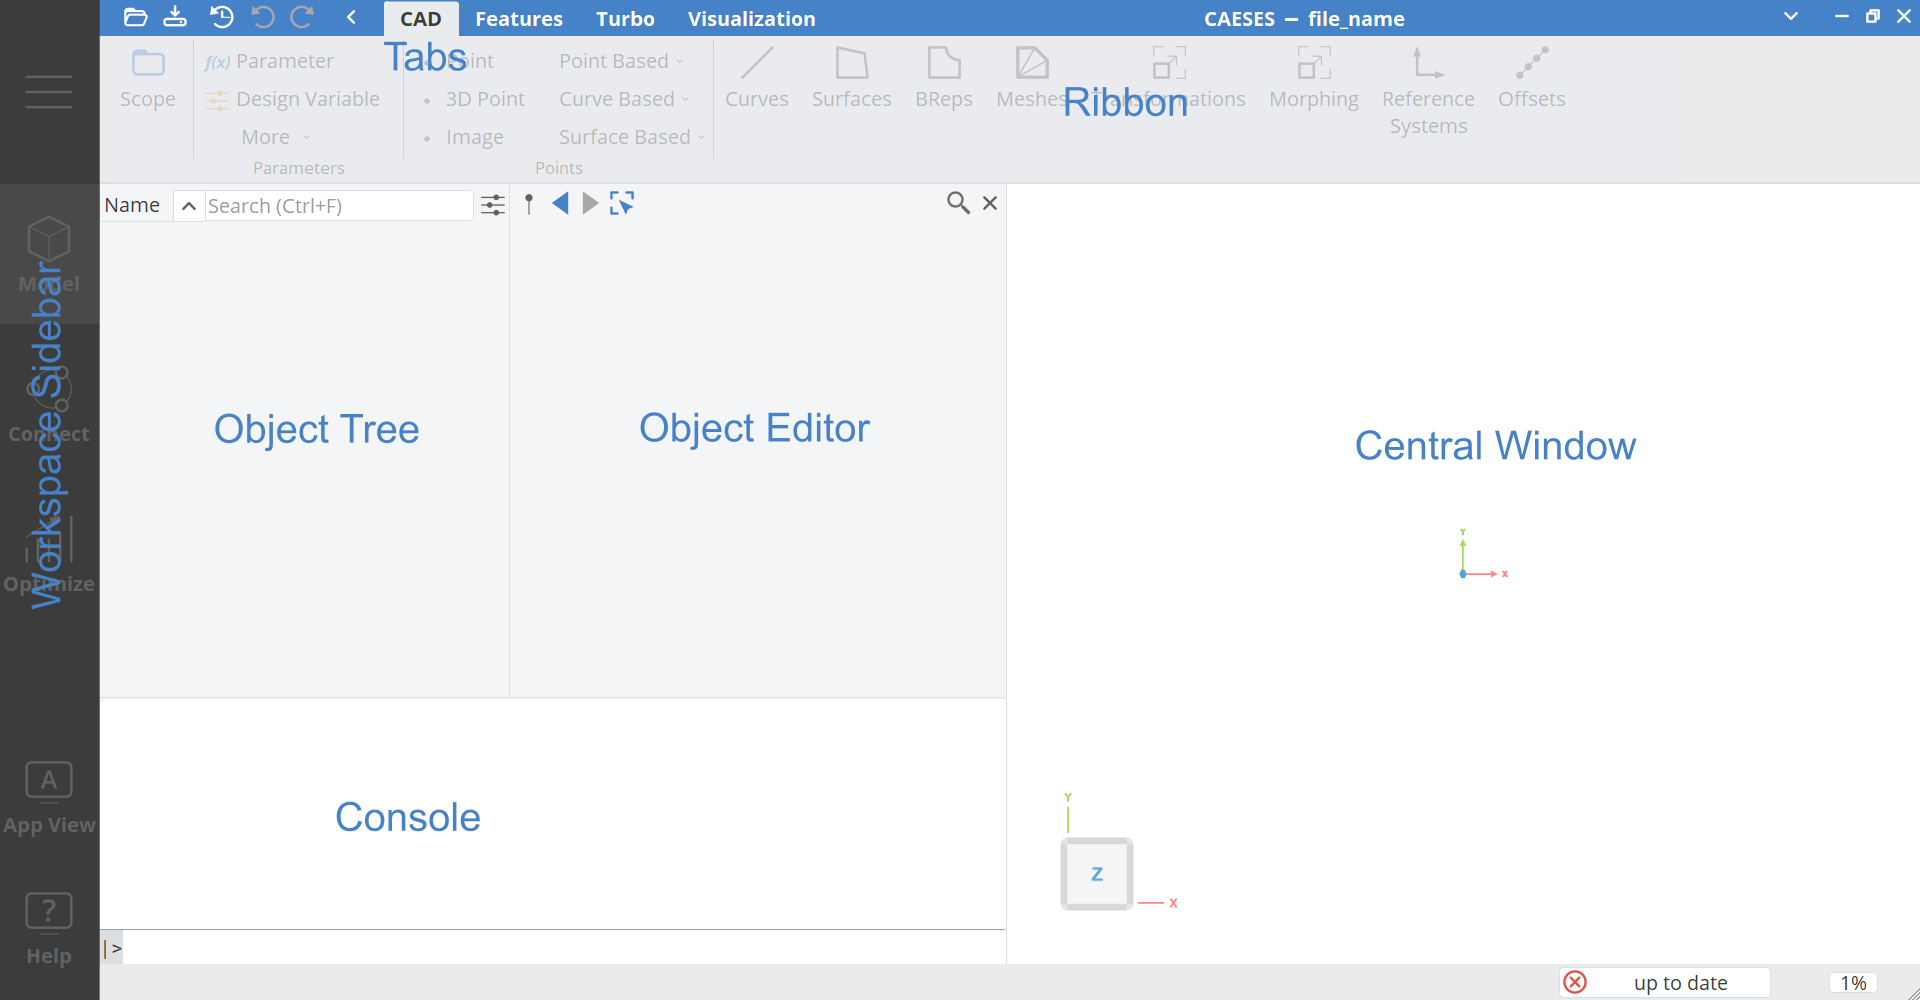
There are five workspaces that determine:
- what kind of tabs are shown, and therefore,
- what functionality is displayed in the ribbon
- what is displayed in the Object Tree and also
- what is shown in the Central Window.
You can find everything that is related to CAD modeling in the corresponding Model workspace. Depending on the purchased add-ons the Model workspace shows additional tabs for Turbo, Propeller and Maritime specific design capabilities.
In the Connect workspace, you can find all objects and windows that are related to connecting external software to CAESES.
Under Optimize you can find your design engines (which are sampling and optimization strategies), constraints, result tables etc.
The Help workspace shows all documentation, tutorials and also lets you open sample projects.
The GUI can be adapted easily to your needs. You can add, delete or hide windows or widgets or rearrange them as you like. The term widget means a user interface component.
Windows
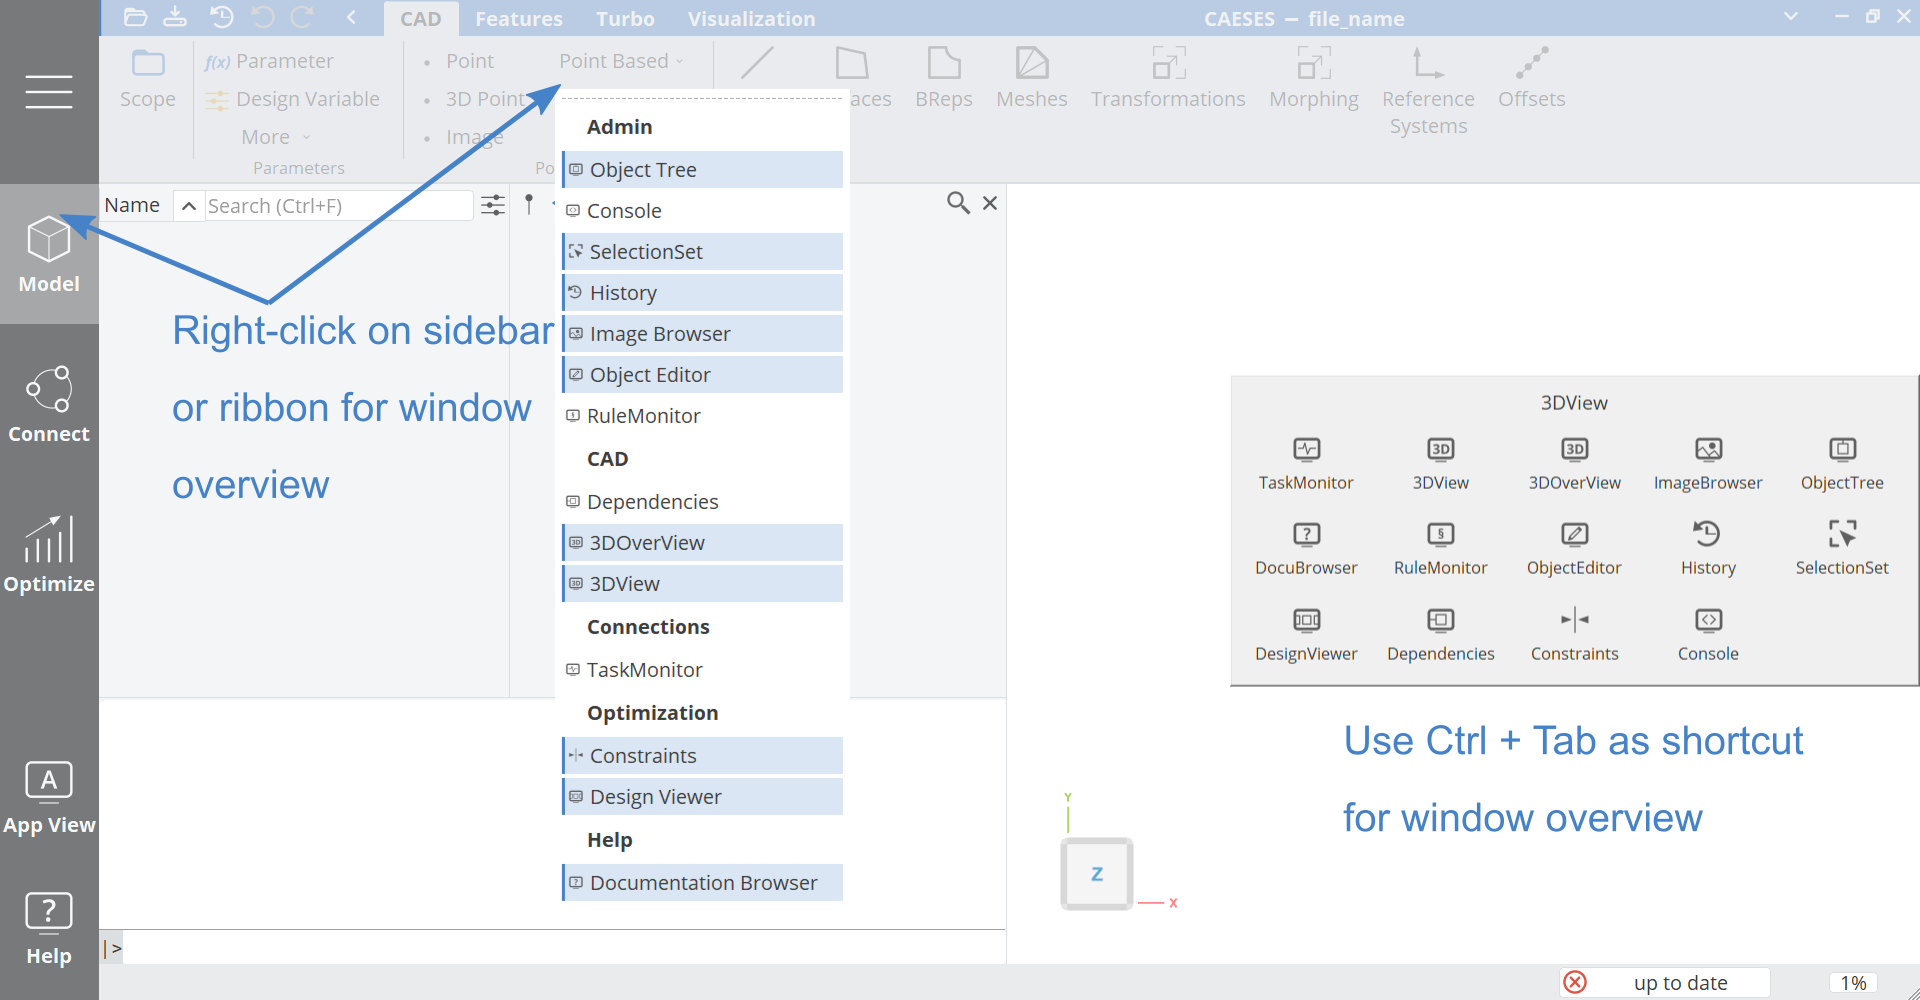
An overview of all windows is opened if you right-click on the black workspace sidebar, or right-click anywhere on the ribbon. All widgets of CAESES such as windows, editors etc. can be quickly found like this.
Alternatively, use Ctrl + Tab to open widgets, such as the object editor or console or views in your current workspace.
Widget Creation
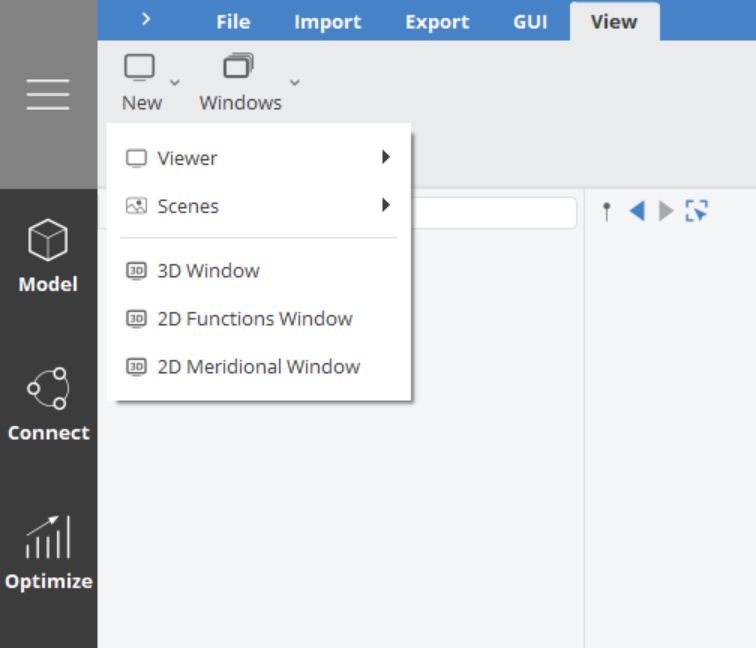
In the Menu workspace you can find the View tab, which allows you to create and add any kind of new widget. A typical example is the creation of additional 3D windows.
Rearranging Windows
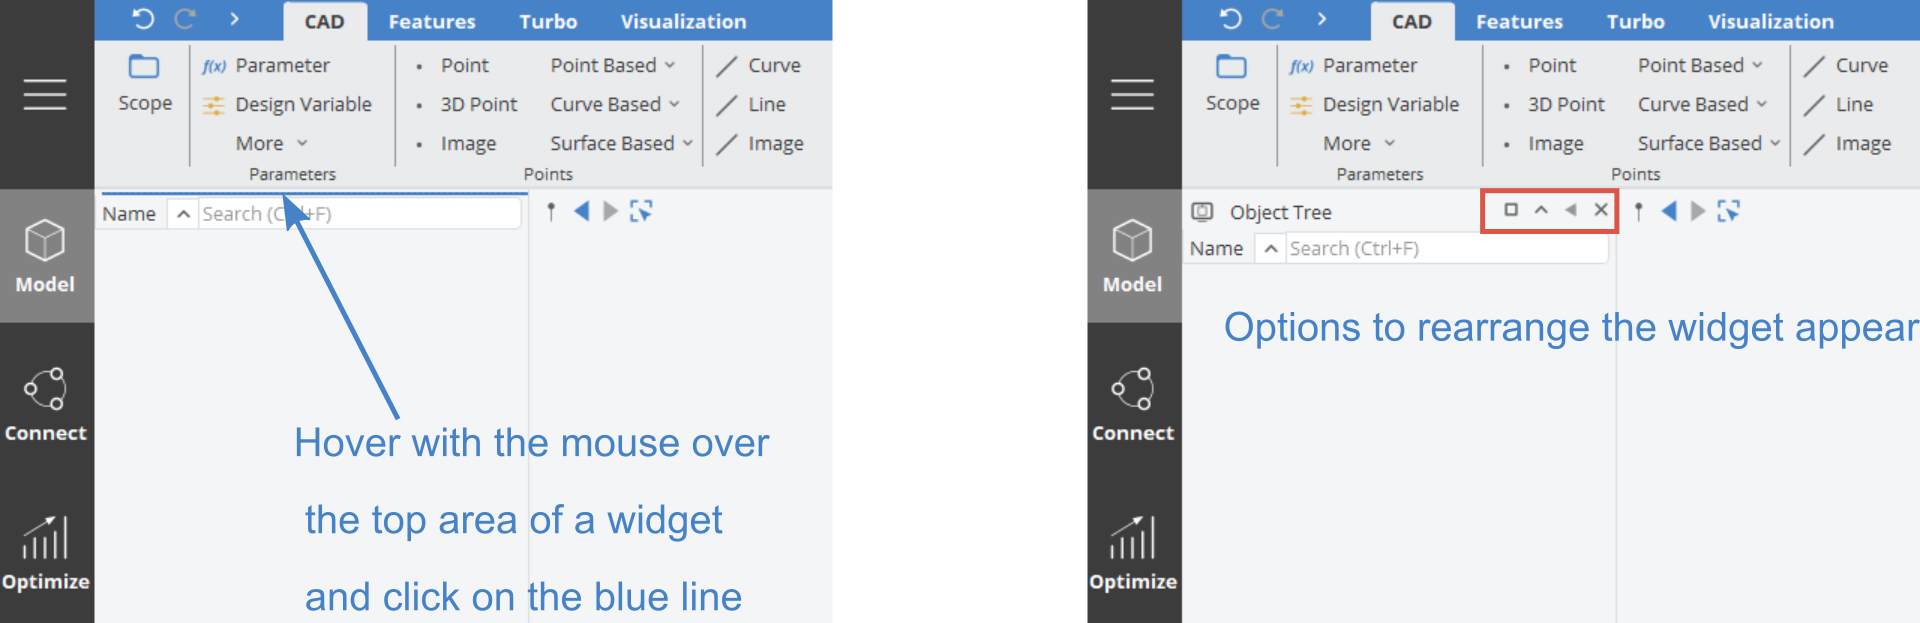
If you hover with your mouse over the top area of each widget, and then click on the header (a blue line), you receive options to rearrange the window. You can drag it around in CAESES to position it somewhere else. You can also make it a central widget (appearing in the central main window), a top level window, or use the shade option.
Saving GUI Layout
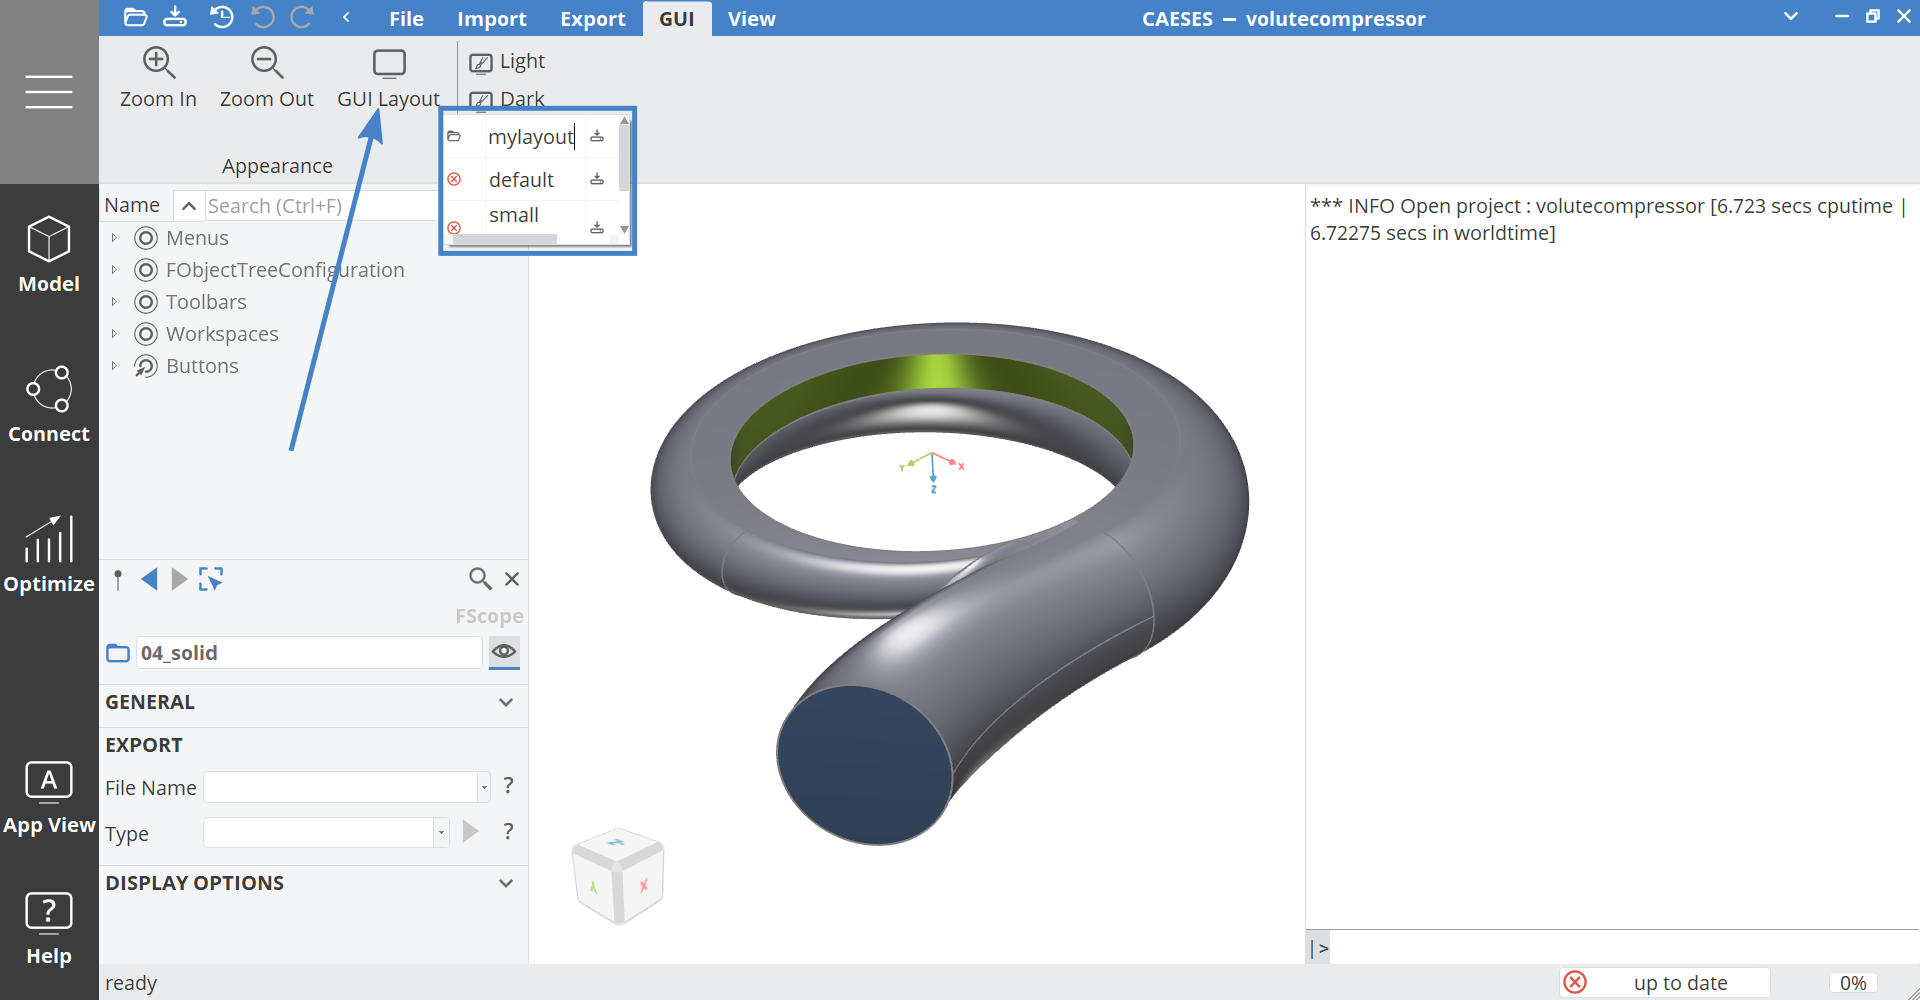
You can rearrange all windows in CAESES, and you can set different backgrounds, camera settings, lights etc. Such a state can then be stored as a GUI Layout. CAESES offers different GUI layouts to choose from, where you also find the possibility to store your own configuration of window positions and setups. You can find these options under the Menu workspace > GUI tab > GUI Layout
Restore Default Settings
If your GUI gets messed up and you want to return to an initial state, just choose the default graphical user interface layout again under the Menu workspace > GUI tab > GUI Layout
If things are still messed up, you can also go back to the factory settings via Menu workspace > File tab Settings > Reset to Factory Settings (click on the button in the lower right corner of the dialog).
GUI Appearance
Zoom In/Out (Change GUI Font Size)
When working with monitors with high resolutions, it can be useful to zoom in the GUI and increase the icon and font size. To Zoom in or out you could use the corresponding buttons in the Menu workspace > GUI tab or simply hold the Ctrl key and press + or - to increase or decrease the font size of the GUI.
Theme
If you would like to switch between a light (default) and a dark theme, go to the Menu workspace > GUI tab and choose a theme.
Ribbon and Sidebar Appearance
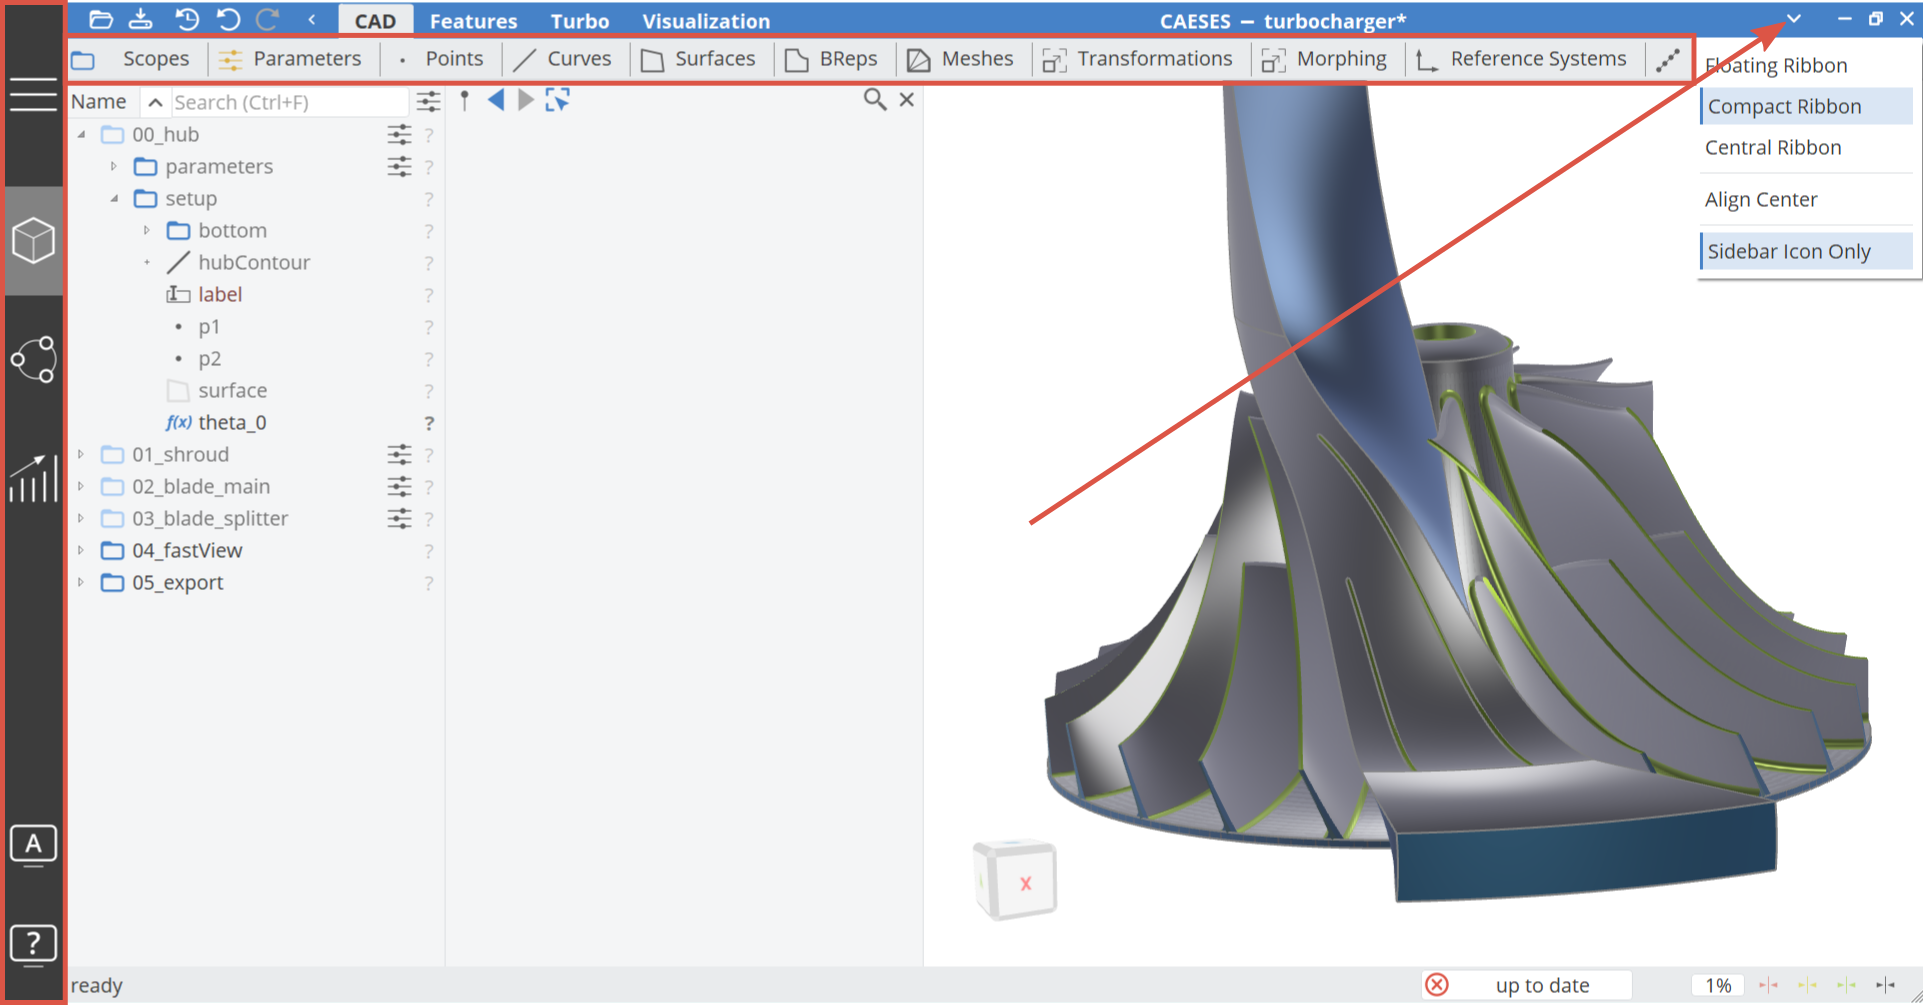
Change the style of the Ribbon and the Sidebar in the top right, and choose between a compact sidebar with icons only, a floating or a compact ribbon, or even align the ribbon in the center.
Profiling - Measure Update Time
The profiler is a useful tool to identify why geometry updates are expensive and time consuming. The profiling mode allows to track update times of objects and sorts them in a list starting with the most time consuming and CPU extensive object updates.
Start the profiling mode by clicking the Profiling button in the lower right corner (next to the update bar)

Once the profiling mode is running the status bar changes to a violet color. Every change you perform in the project, e.g. change parameter or input values, while the profiling mode is activated, will be measured until you deactivate it by clicking the profiling button again.
Clicking an object in the profiling results window shows it in the tree, double clicking selects the object.