Shape Optimization in CAESES
CAESES provides a set of sampling and optimization strategies in an integrated environment. New design candidates can be generated in a fully automated way, and CAESES takes care of all the variant management.
CAESES also provides advanced shape optimization capabilities that include response surfaces (surrogate models), CTC server for distributing runs, interactive charts, comprehensive result tables and diagrams as well as PDF reports.
Design Engines
The strategies are called design engines in CAESES. You can find them in the optimization menu.
Design engines hold the information about the strategy used, the design variables, the evaluations and objectives as well as the constraints.
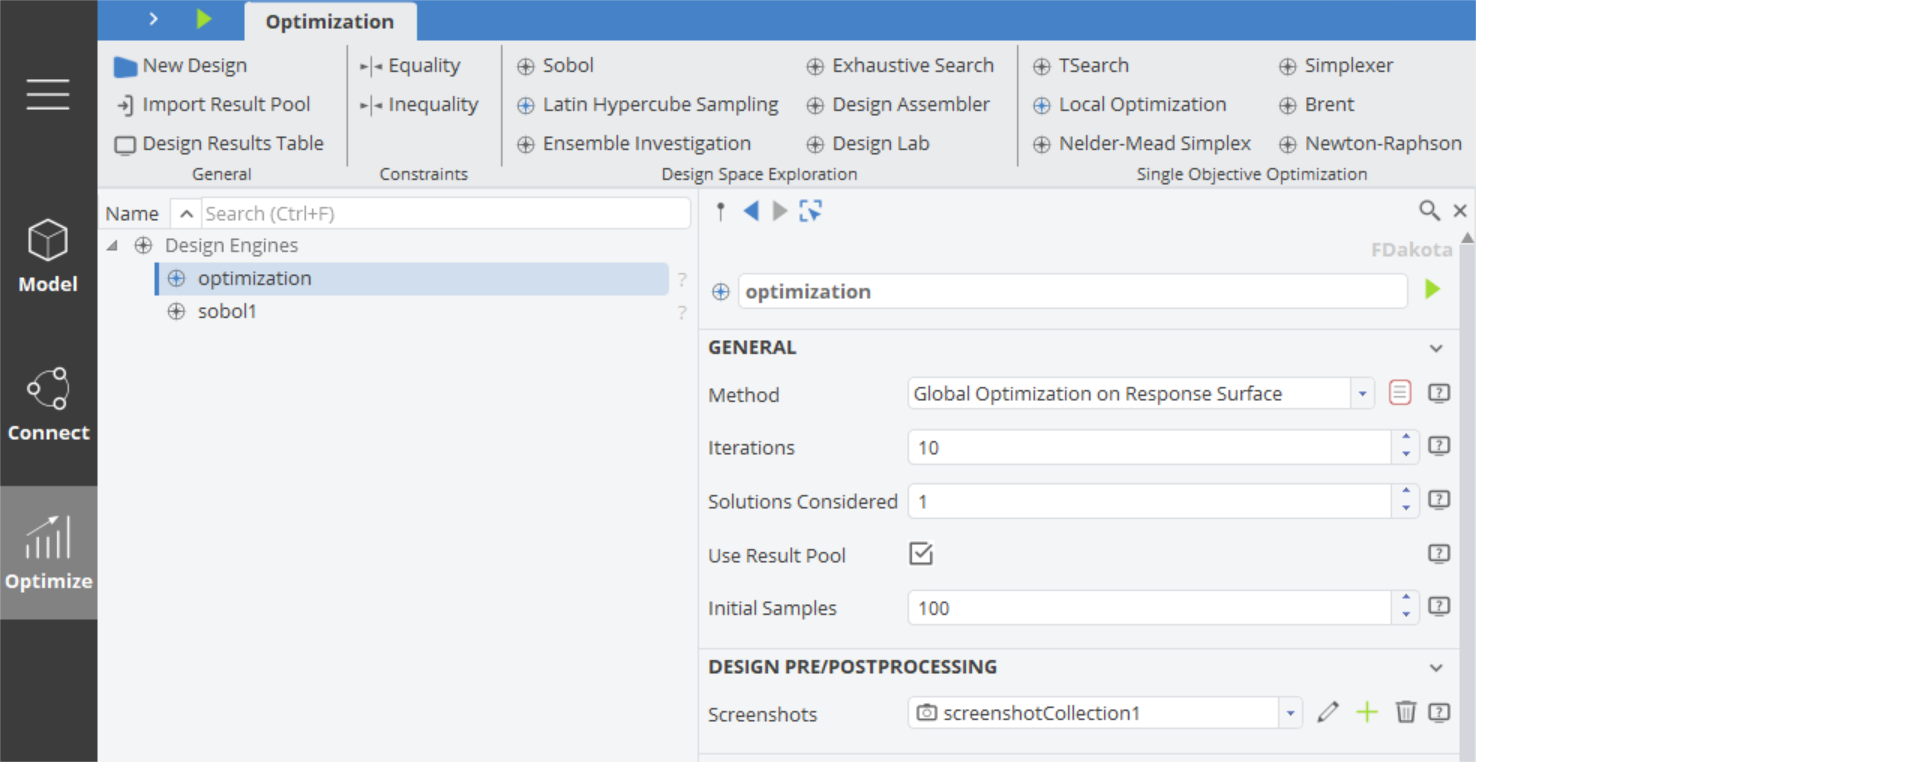
Once you have configured a design engine (e.g. a sampling engine) and you need another one (e.g. an optimization engine), then just select the first one and create the second one. The selection is considered during creation and copies the full setup which saves a lot of time if you have a large set of design variables and evaluations.
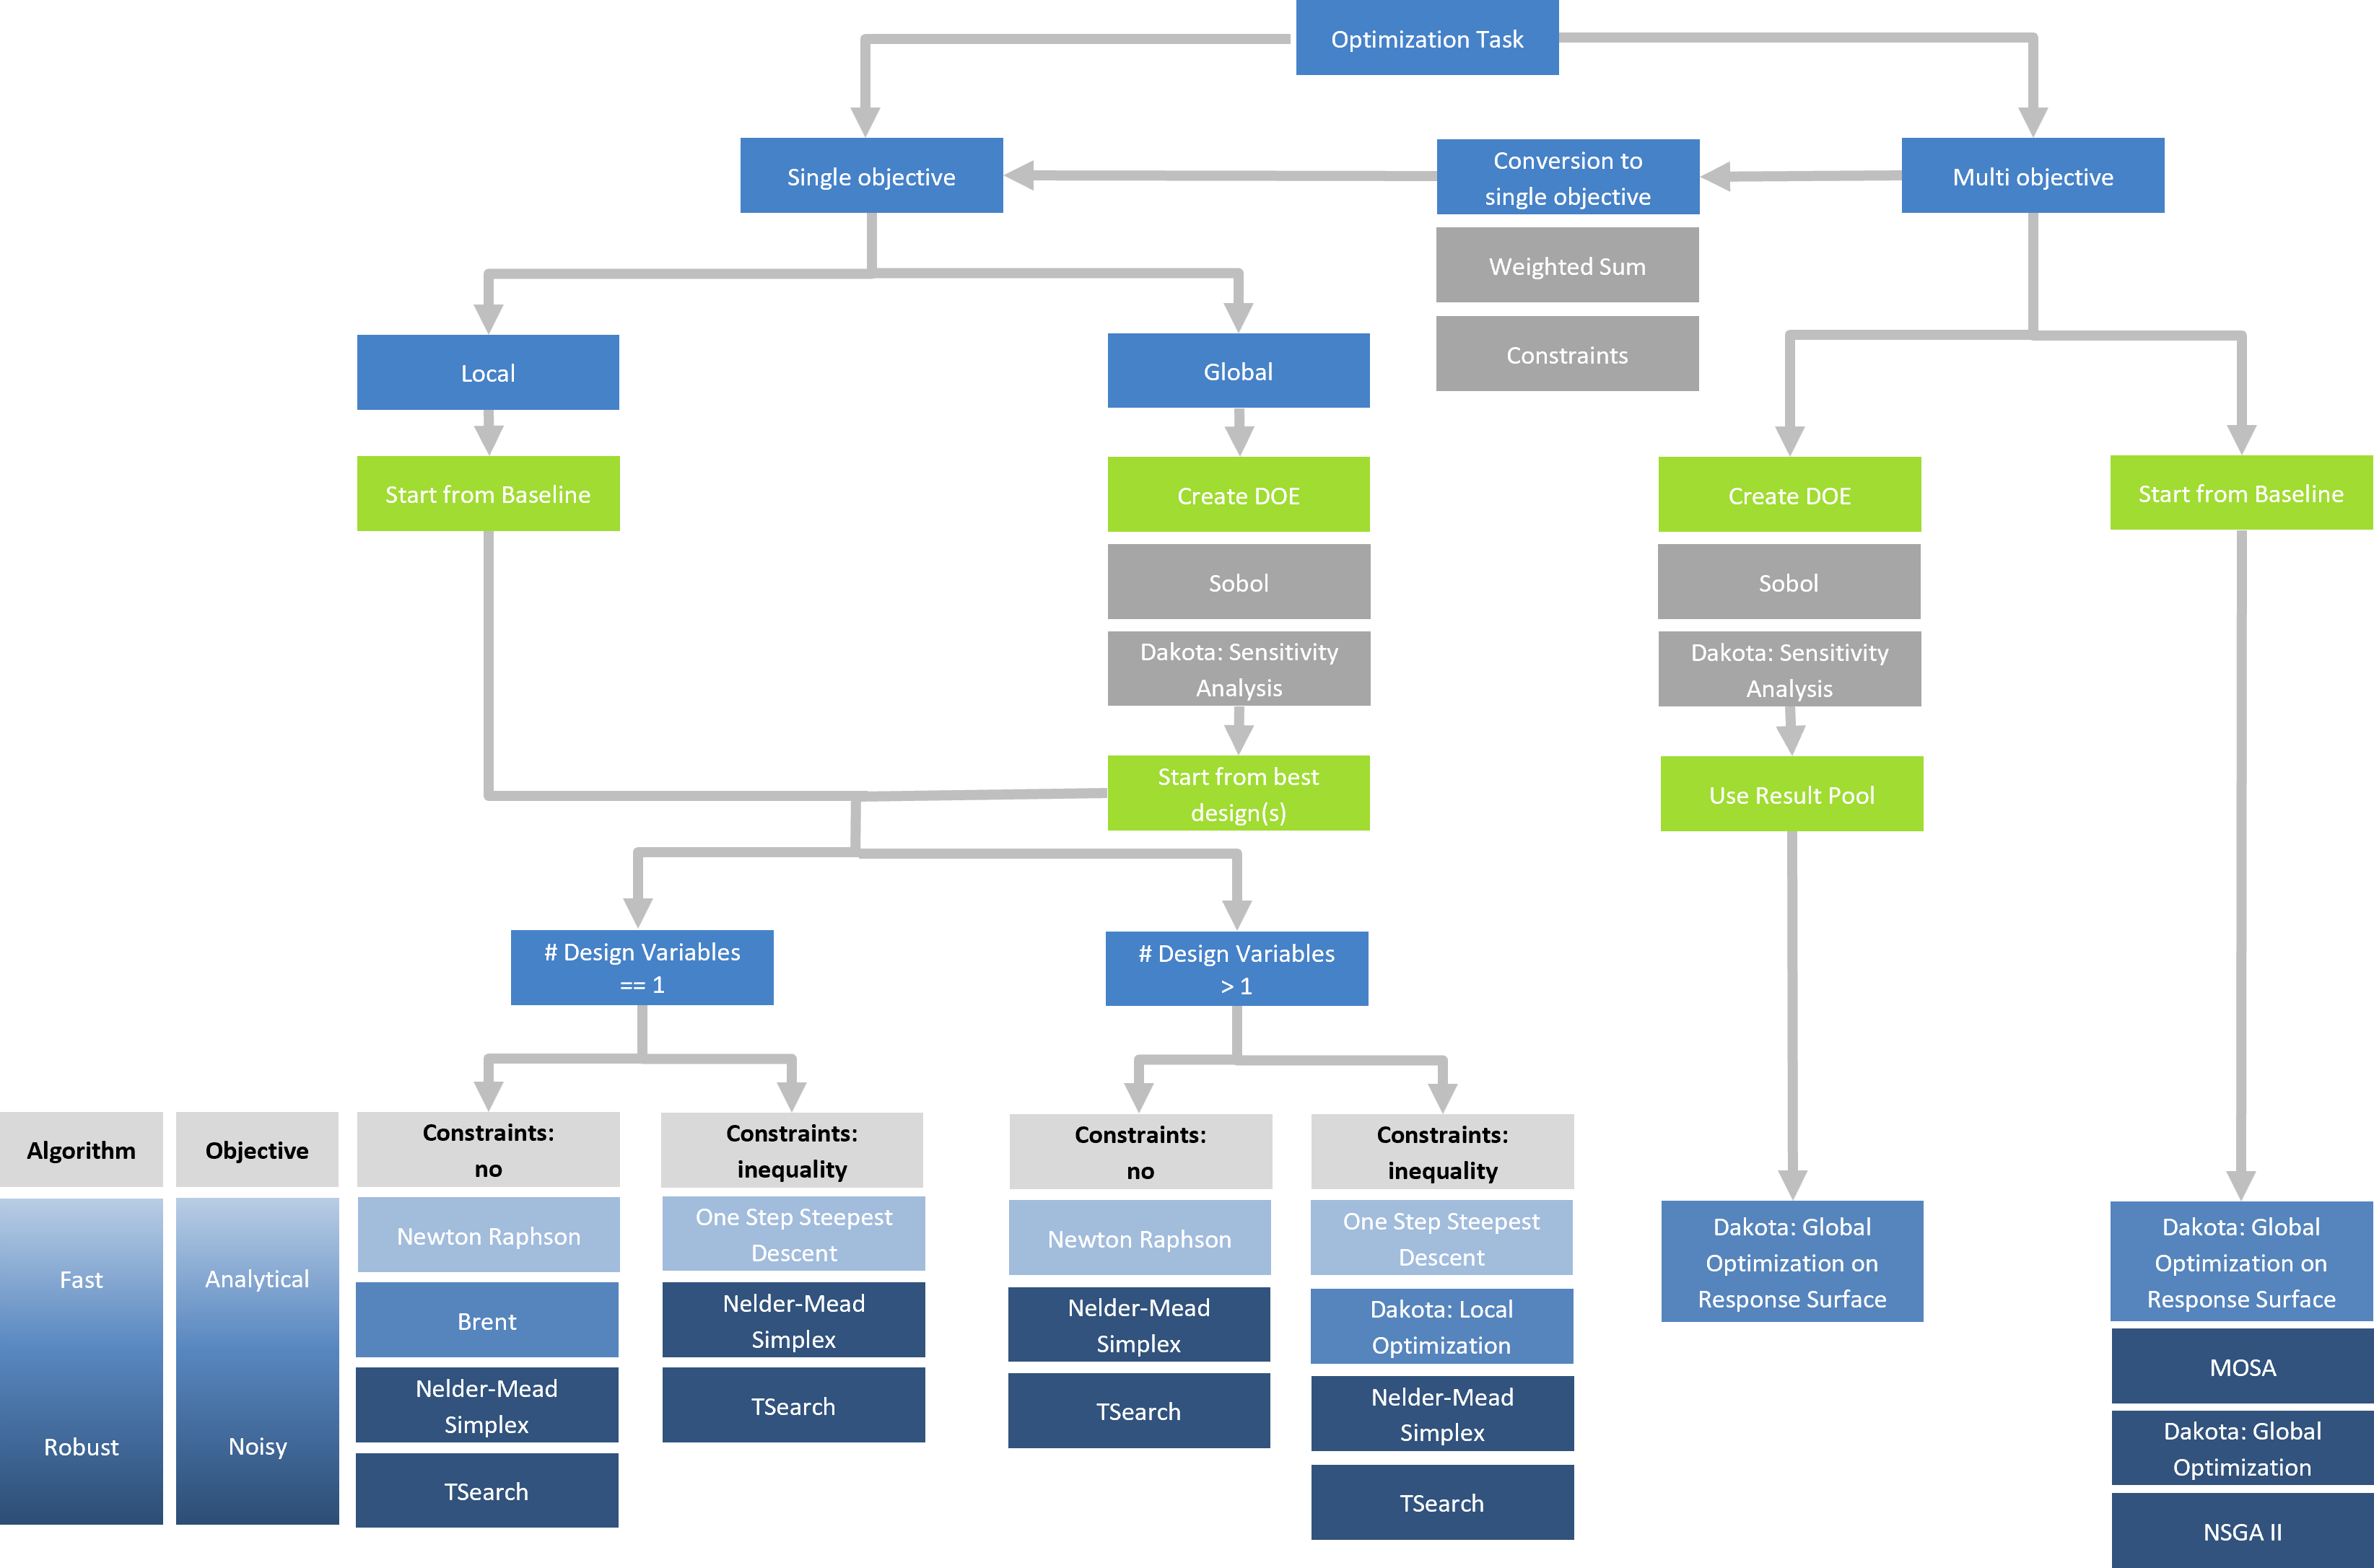
Here is an overview of different strategies to an optimization task:
Screenshot Collection
Design engines also allow you to create screenshot collections so that for each generated design a set of screenshots is stored. These images can be used for animations, in presentations or in the CAESES design viewer (see section below) for side-by-side comparisons.
Results File
Design engines automatically create a results table and two result files (*.csv) in the run directory. These files can be used for external post-processing or for monitoring during batch mode runs. The best designs are stored in a separate file.
Design Pre-/Post-Processing
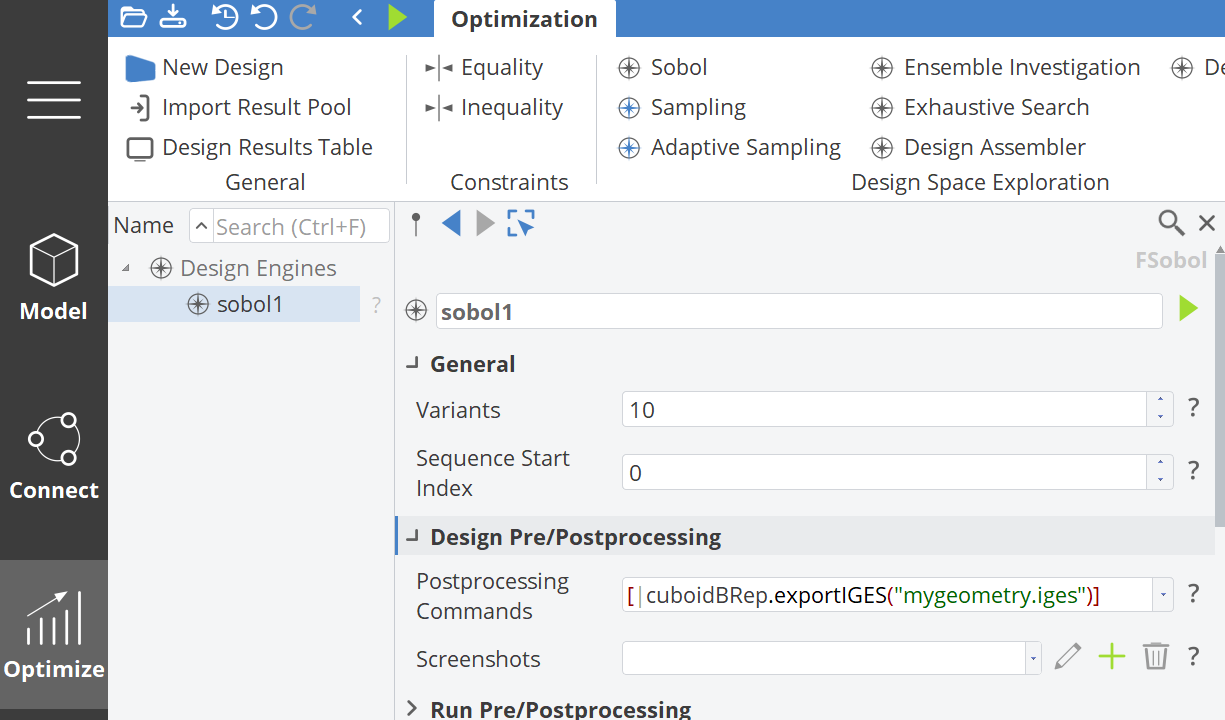
You can set additional commands that should be triggered before a design is created, and once the design creation has been finished. This is useful if you need to prepare something before creating a design (input etc.) or you want to collect information after each design.
If you want to export each design variant geometry e.g. in the IGES format (without setting up a software connector), you can run the export command <objectName>.exportIges(<filename>) in the Design Post-Processing (expand the category by clicking on the Design Pre/Postprocessing heading to see the input field).
Run Pre-/Post-Processing
Right before the run is started, you can also trigger some preparation commands (e.g. copying a file to a specific location). And, finally, you can set post-processing commands that are triggered after the entire design engine run - before CAESES turns back into the normal mode.
Objective Functions and Evaluations
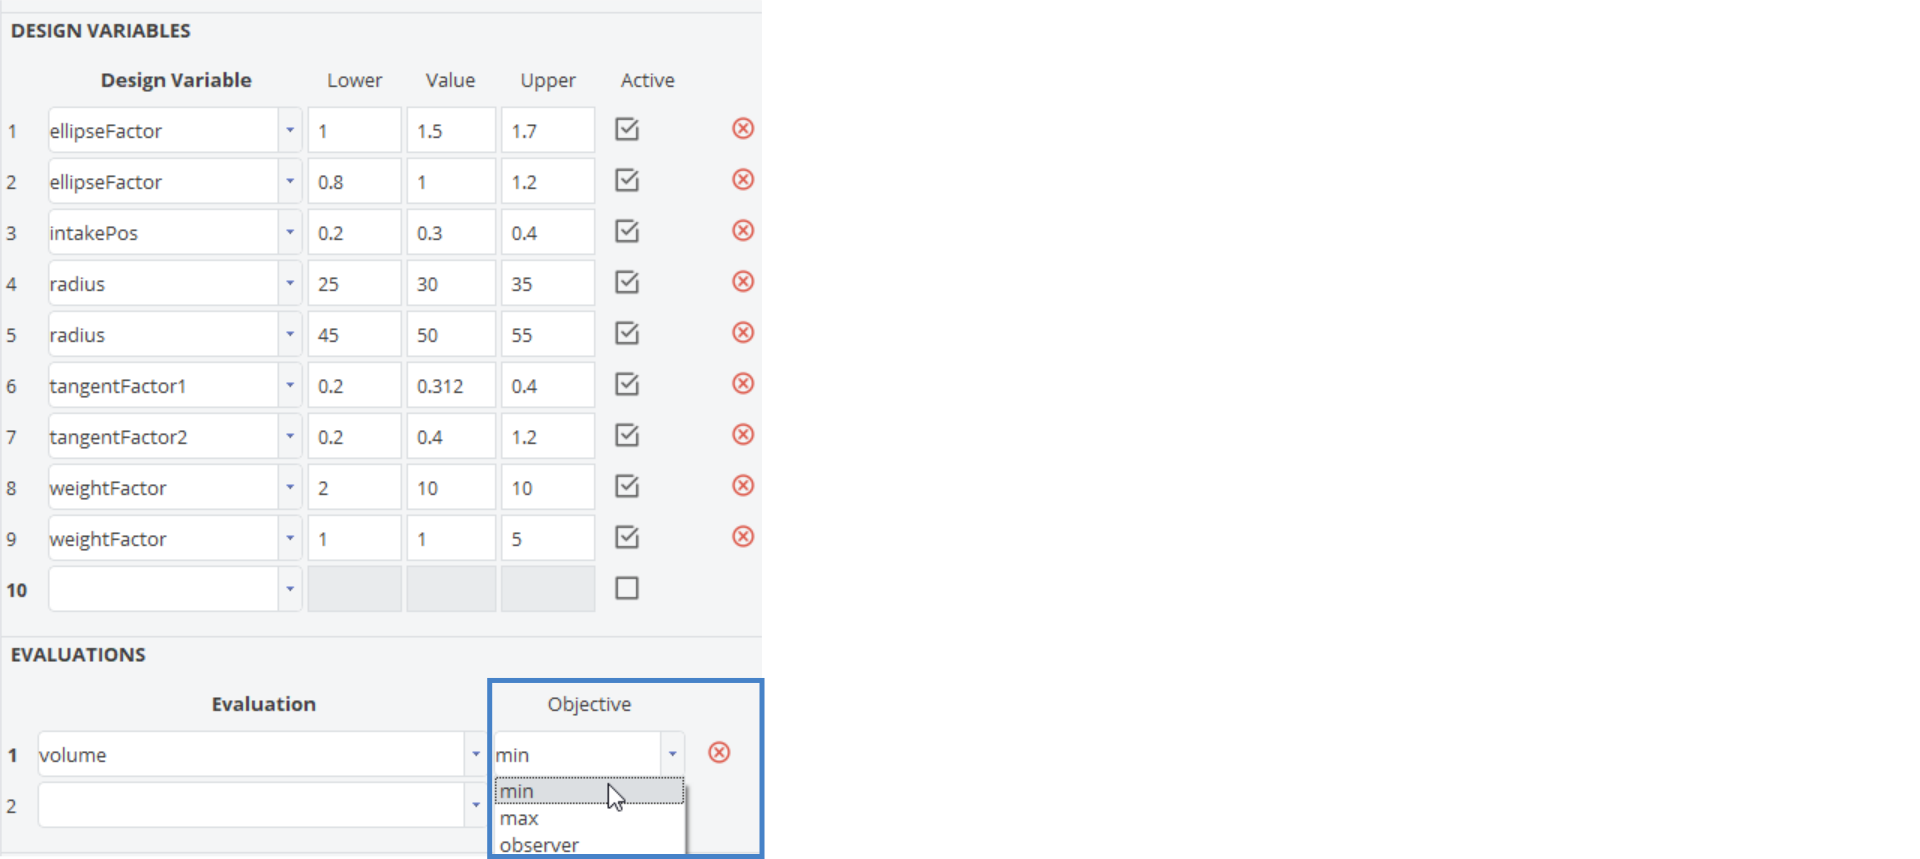
In CAESES you create parameters via CAD > parameters > parameter that you can then set at the design engines for monitoring or as objective function. These parameters can hold any expression to define even complex objectives. Parameters can also hold expressions that extract results values from computation results (e.g. simulation data), which is described in the section "Software Connector".
The evaluation parameter can be minimized, maximized or just observed:
Design Variables
To automatically control the model with a design engine, you need to have design variables. See this section for more information. Design variables are linked to the variable geometry and get controlled by algorithms that are called design engines.
Constraints
Equality and inequality constraints can be created through the optimization menu:
- Optimize > Optimization > Constraints > Inequality Constraint
- Optimize > Optimization > Constraints > Equality Constraint
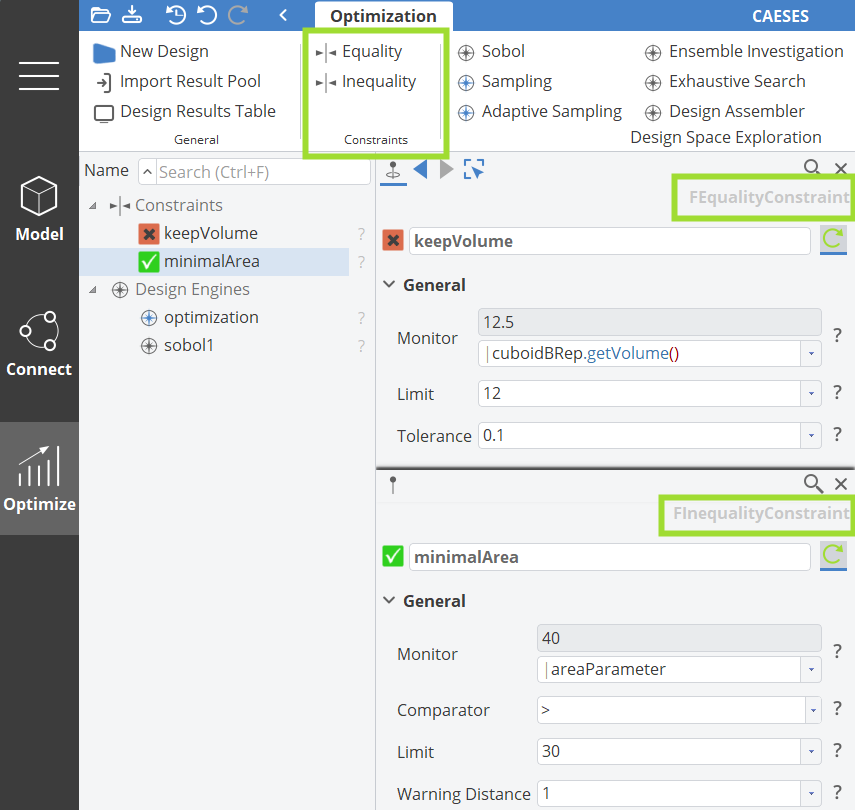
You can then configure these constraints to monitor parameters, and set them at the design engines. At design engines you can choose whether the constraint is just evaluated and monitored, or really considered by the algorithms during optimizations for which you have to set it active.
If constraints are violated for a design, you will see a corresponding red design icon (instead of a green one).
In order to avoid the execution/triggering of the software connection computation if a constraint is violated, set the constraints in the Execution Settings in the Software Connector. Read more in the Computation Section.
Design Tree
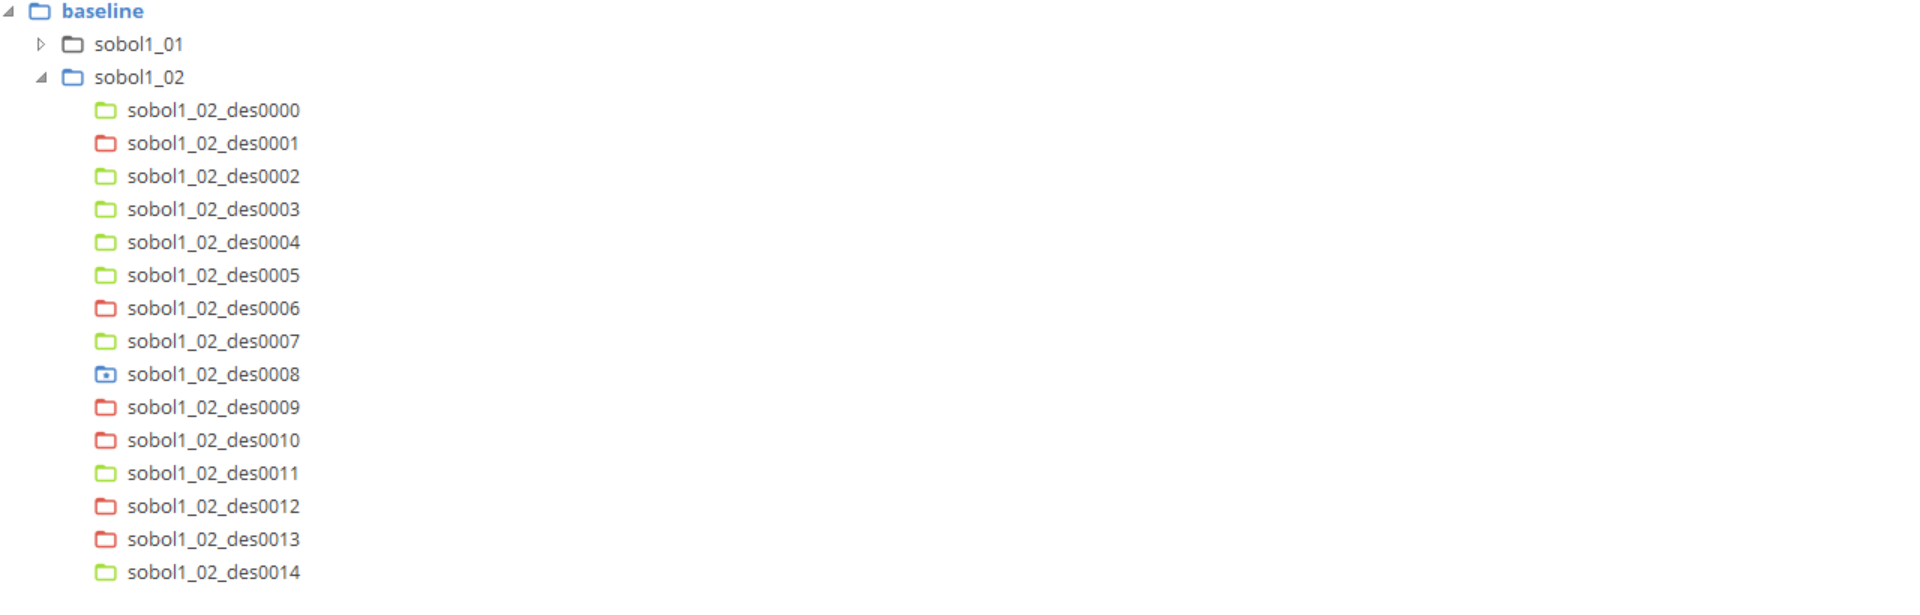
The design engine run creates designs that are then displayed in the design tree.
Icons
Green icons indicate a feasible design that does not violate any constraint or that did not fail. Failed designs typically do not have any result values e.g. the computation/analysis failed to run or finish correctly (crash etc.).
The blue icon with the yellow star indicates best design(s) with regards to the objective(s) that are chosen at the design engine.
Note that also sampling algorithms and not just optimization strategies can show best designs based on the chosen objective.
Activate a Design
If you double-click on a design, it gets activated, i.e. it is the current design. In the object editor of a selected design, there is also the possibility to unlock - generated designs are locked by default to avoid accidental changes to a design.
Active designs can be investigated in the CAD tree. All objects (curves, surfaces, parameters etc.) show the values of the current design, and the geometry of the current design is also displayed in the 3D view.
Displaying Results
If you click on the small result icon on the right-hand side, it will load existing results (e.g. table data, 3D post-processing data , pictures) into the user interface of CAESES. This means that result loading is done on user request to save memory resources of your system.
Check the different widgets (3D view, picture viewer, table viewer) to see these results.
Design Results Table
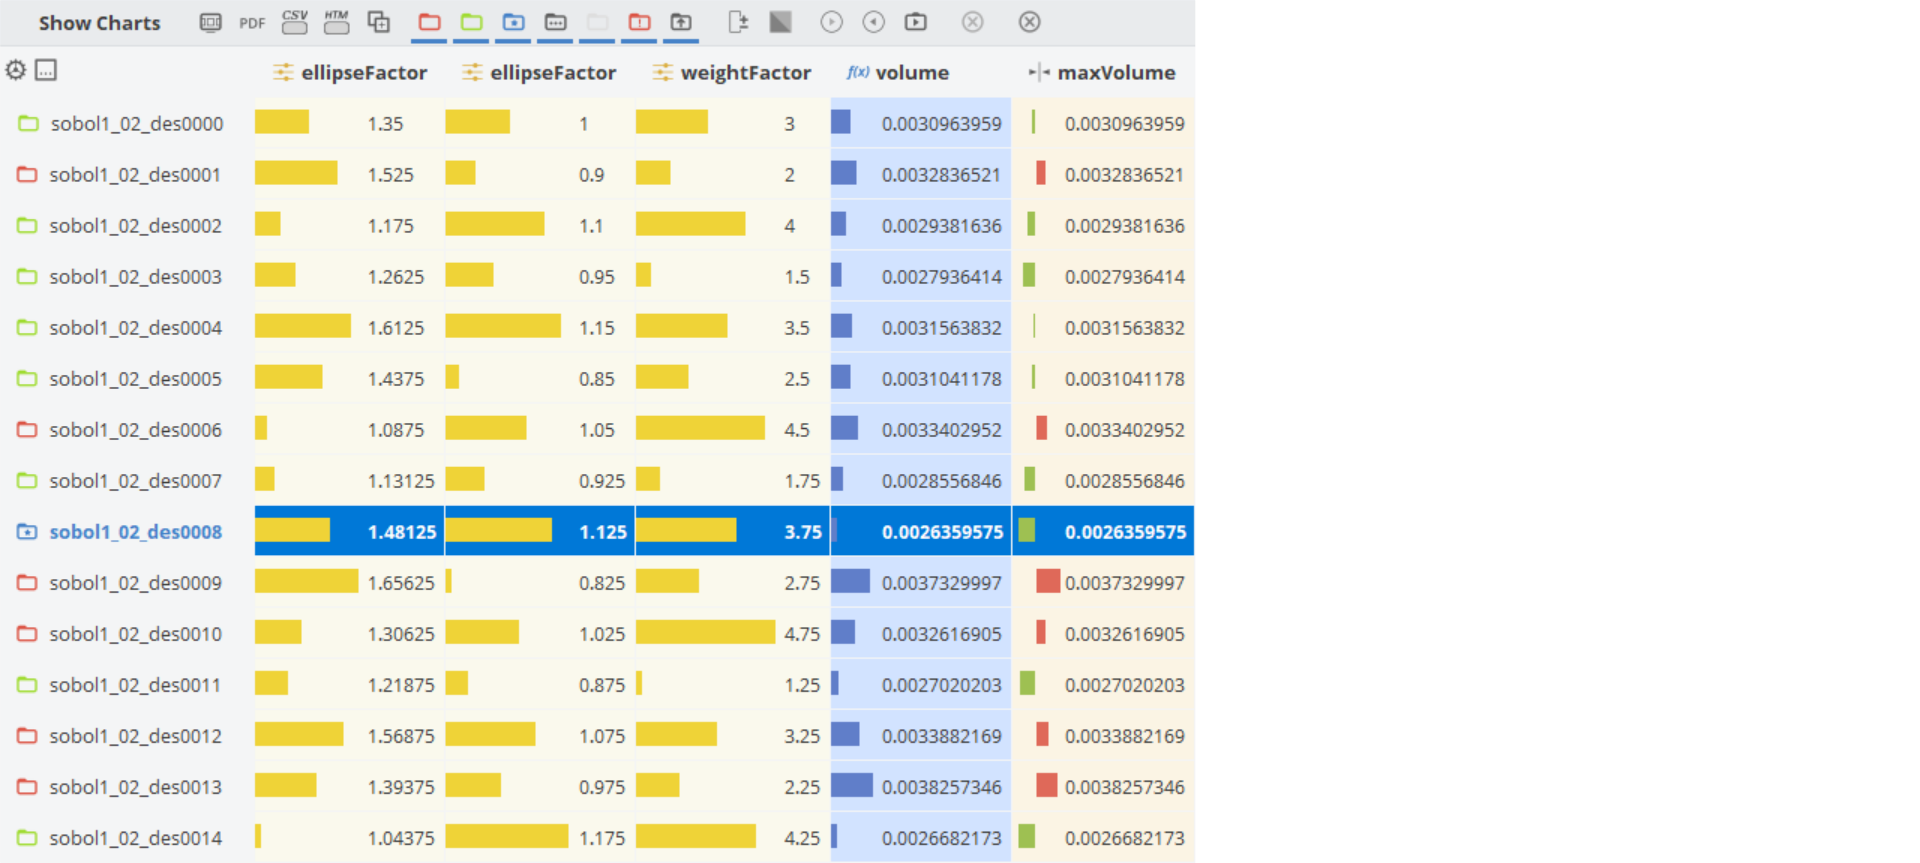
The design engine generates a table with all the designs and their results. At the top of the table, you find further widgets and settings to analyze the table data.
Activate a Design
If you double-click on a design in the table, it gets active (see also section "Activate a Design").
Sorting
If you click on the header of a column, the design get sorted according to their values.
Re-Evaluate and Re-Read Design Results
There are two buttons to re-evaluate a design, and to re-read design results (without evaluating it again). This is sometimes helpful if problems occurred for a design during the run.
Screenshot Collection
The table gives you the possibility to re-generated screenshots for the design viewer, for which you can use an existent screenshot collection, or you need to create a new one during the process. Just click on the screenshot icon in the toolbar.
Design Viewer
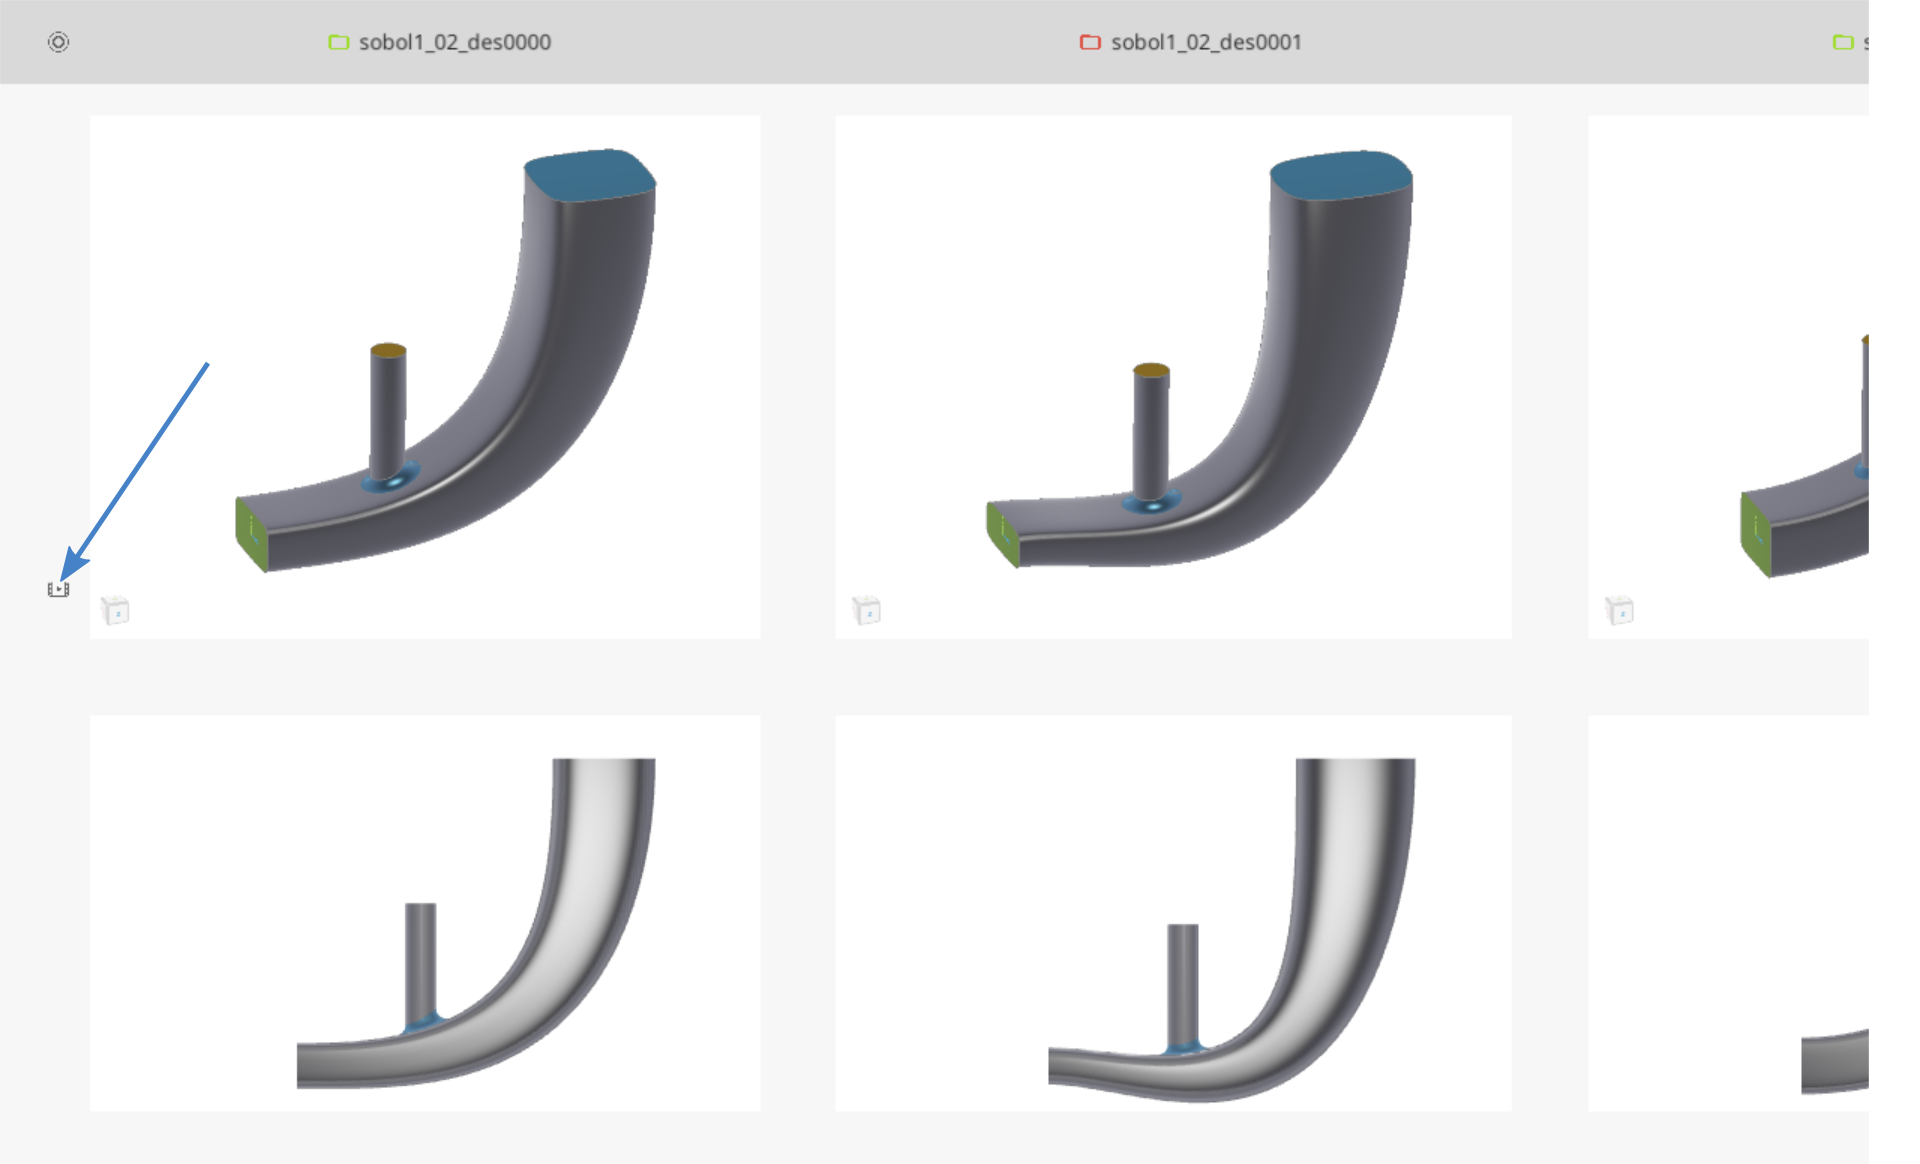
The design viewer can be accessed at the top toolbar of the table. It allows you to do side-by-side comparisons. Screenshots are taken into account (see the screenshot section above).
Interactive 3D Geometry
Geometry data of each design is also stored for comparing the different designs interactively (e.g. zooming, rotating). Use the Ctrl key in the geometry row (last row) of the viewer to navigate in this little window.
Computation Results
If you have results such as pictures or volume meshes with CFD results, you can also have a side-by-side comparison of these data sets as well in the design viewer.
GIF Animations
There is also a "movie" icon at the left of the design viewer (for each row) to create GIF animations from the set of screenshots.
Charts
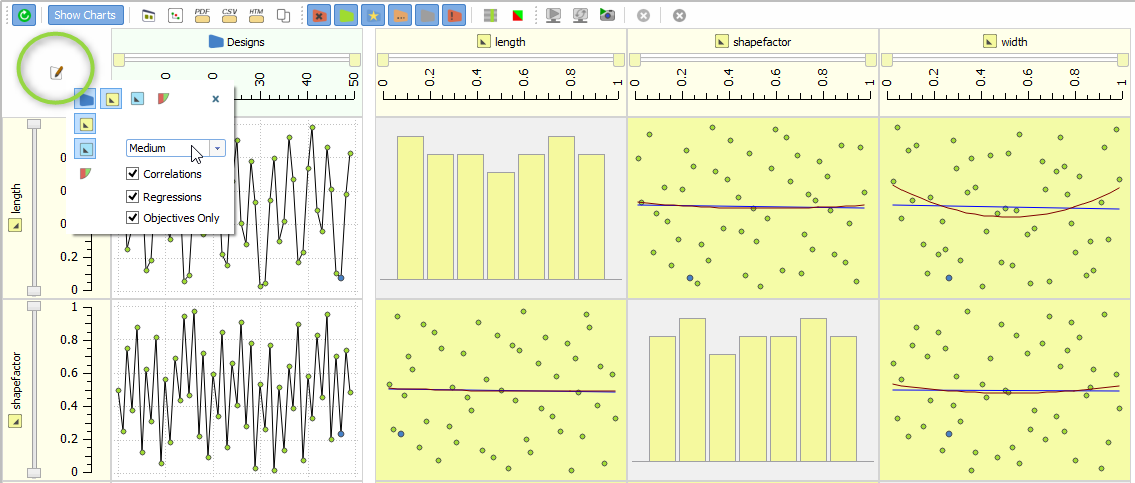
If you click on "Show Charts" in the table toolbar, you will see interactive charts of your table data. The charts show you correlations and regression curves. You can also select designs directly in the charts, so that they also get selected in the design tree where you see all design details.
Chart Settings
In the upper left corner of the charts, there is the edit button to configure what to see. You can switch on and off design variables, parameters and constraints. The size of the data can also be configured.
Colors
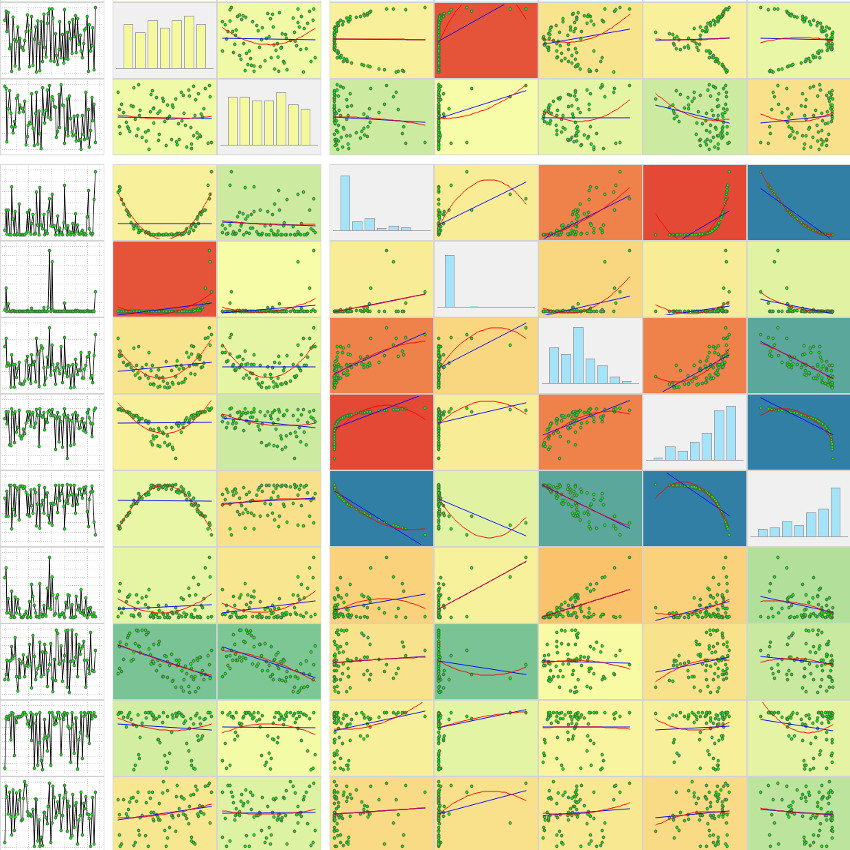
Colors are of interest to check the (linear) correlations. For instance:
-
Reddish colors indicate a trend such that if the design variable (abscissa) gets increased, the objective increases as well. The regression curve would go up.
-
Blueish colors indicate a negative correlation, i.e., if the design variable gets increased, the objective function decreases.
With this information, you can e.g. check which design variables have no substantial effect on your objective function. These variables could be deactivated in the next optimization stage.
PDF Reports
The toolbar contains buttons to create PDF reports. You can set a company name and logo in the preferences (Menu > settings > company profile) which then will be viewed on the first page of the reports.
CSV Data
There is another button to copy the table as csv-data so that it can be pasted directly into tools such as Excel etc.